
Deep-sea observations of seamounts off the coast of British Columbia have revealed a haunting and threatened ecosystem.
Once-vibrant gardens of sponges and corals are showing signs of stress and death.
These undersea mountains are a global treasure that have been proposed as a new marine protected area.
But climate change is making their future uncertain, providing more reason to support the too-often overlooked pursuit of “long science.”
Researchers with Fisheries and Oceans Canada use the remotely operated vehicle Hercules to investigate a colony of bugle sponges on Explorer Seamount off the British Columbia coast in 2018. Video by Shelton Du Preez and Northeast Pacific Seamount Expedition Partners
Going Deep: The Perils and Promise of Long Science
From the deep ocean to the atmosphere, long-term research is key to understanding Earth’s complex systems. But to keep these studies going, scientists often have to swim against the current.
By Christopher Pollon, Tyee Bridge, and Jonathan Kellogg
May 9, 2023 | 5,200 words, about 24 minutes
This article is also available in audio format. Listen now, download, or subscribe to “Hakai Magazine Audio Edition” through your favorite podcast app.
A forest of bamboo coral comes into the grainy view of a drop camera. More than 650 meters below the ocean’s surface, these rarely seen organisms—actually colonies of thousands of individual polyps—have some unique qualities.
A draping shag of tentacles near the bottom of the colony is a defensive curtain of potent stinging cells that fend off predatory nudibranchs and sea stars. When disturbed, the colony lights up with bioluminescence.
These creatures are also old. Bamboo coral grows only about a centimeter a year, and the specimens revealed by the remote camera, some of them two meters tall, have likely been growing since the early 1800s. Besides their graceful beauty, corals like these provide habitat for octopuses, shrimp, and many other species.
This deep-sea habitat exists on an underwater mountain called a seamount. Located in the open waters of the northeast Pacific Ocean—a few hundred kilometers off the coast of Vancouver Island, British Columbia—it is part of one of the densest clusters of seamounts in the world.
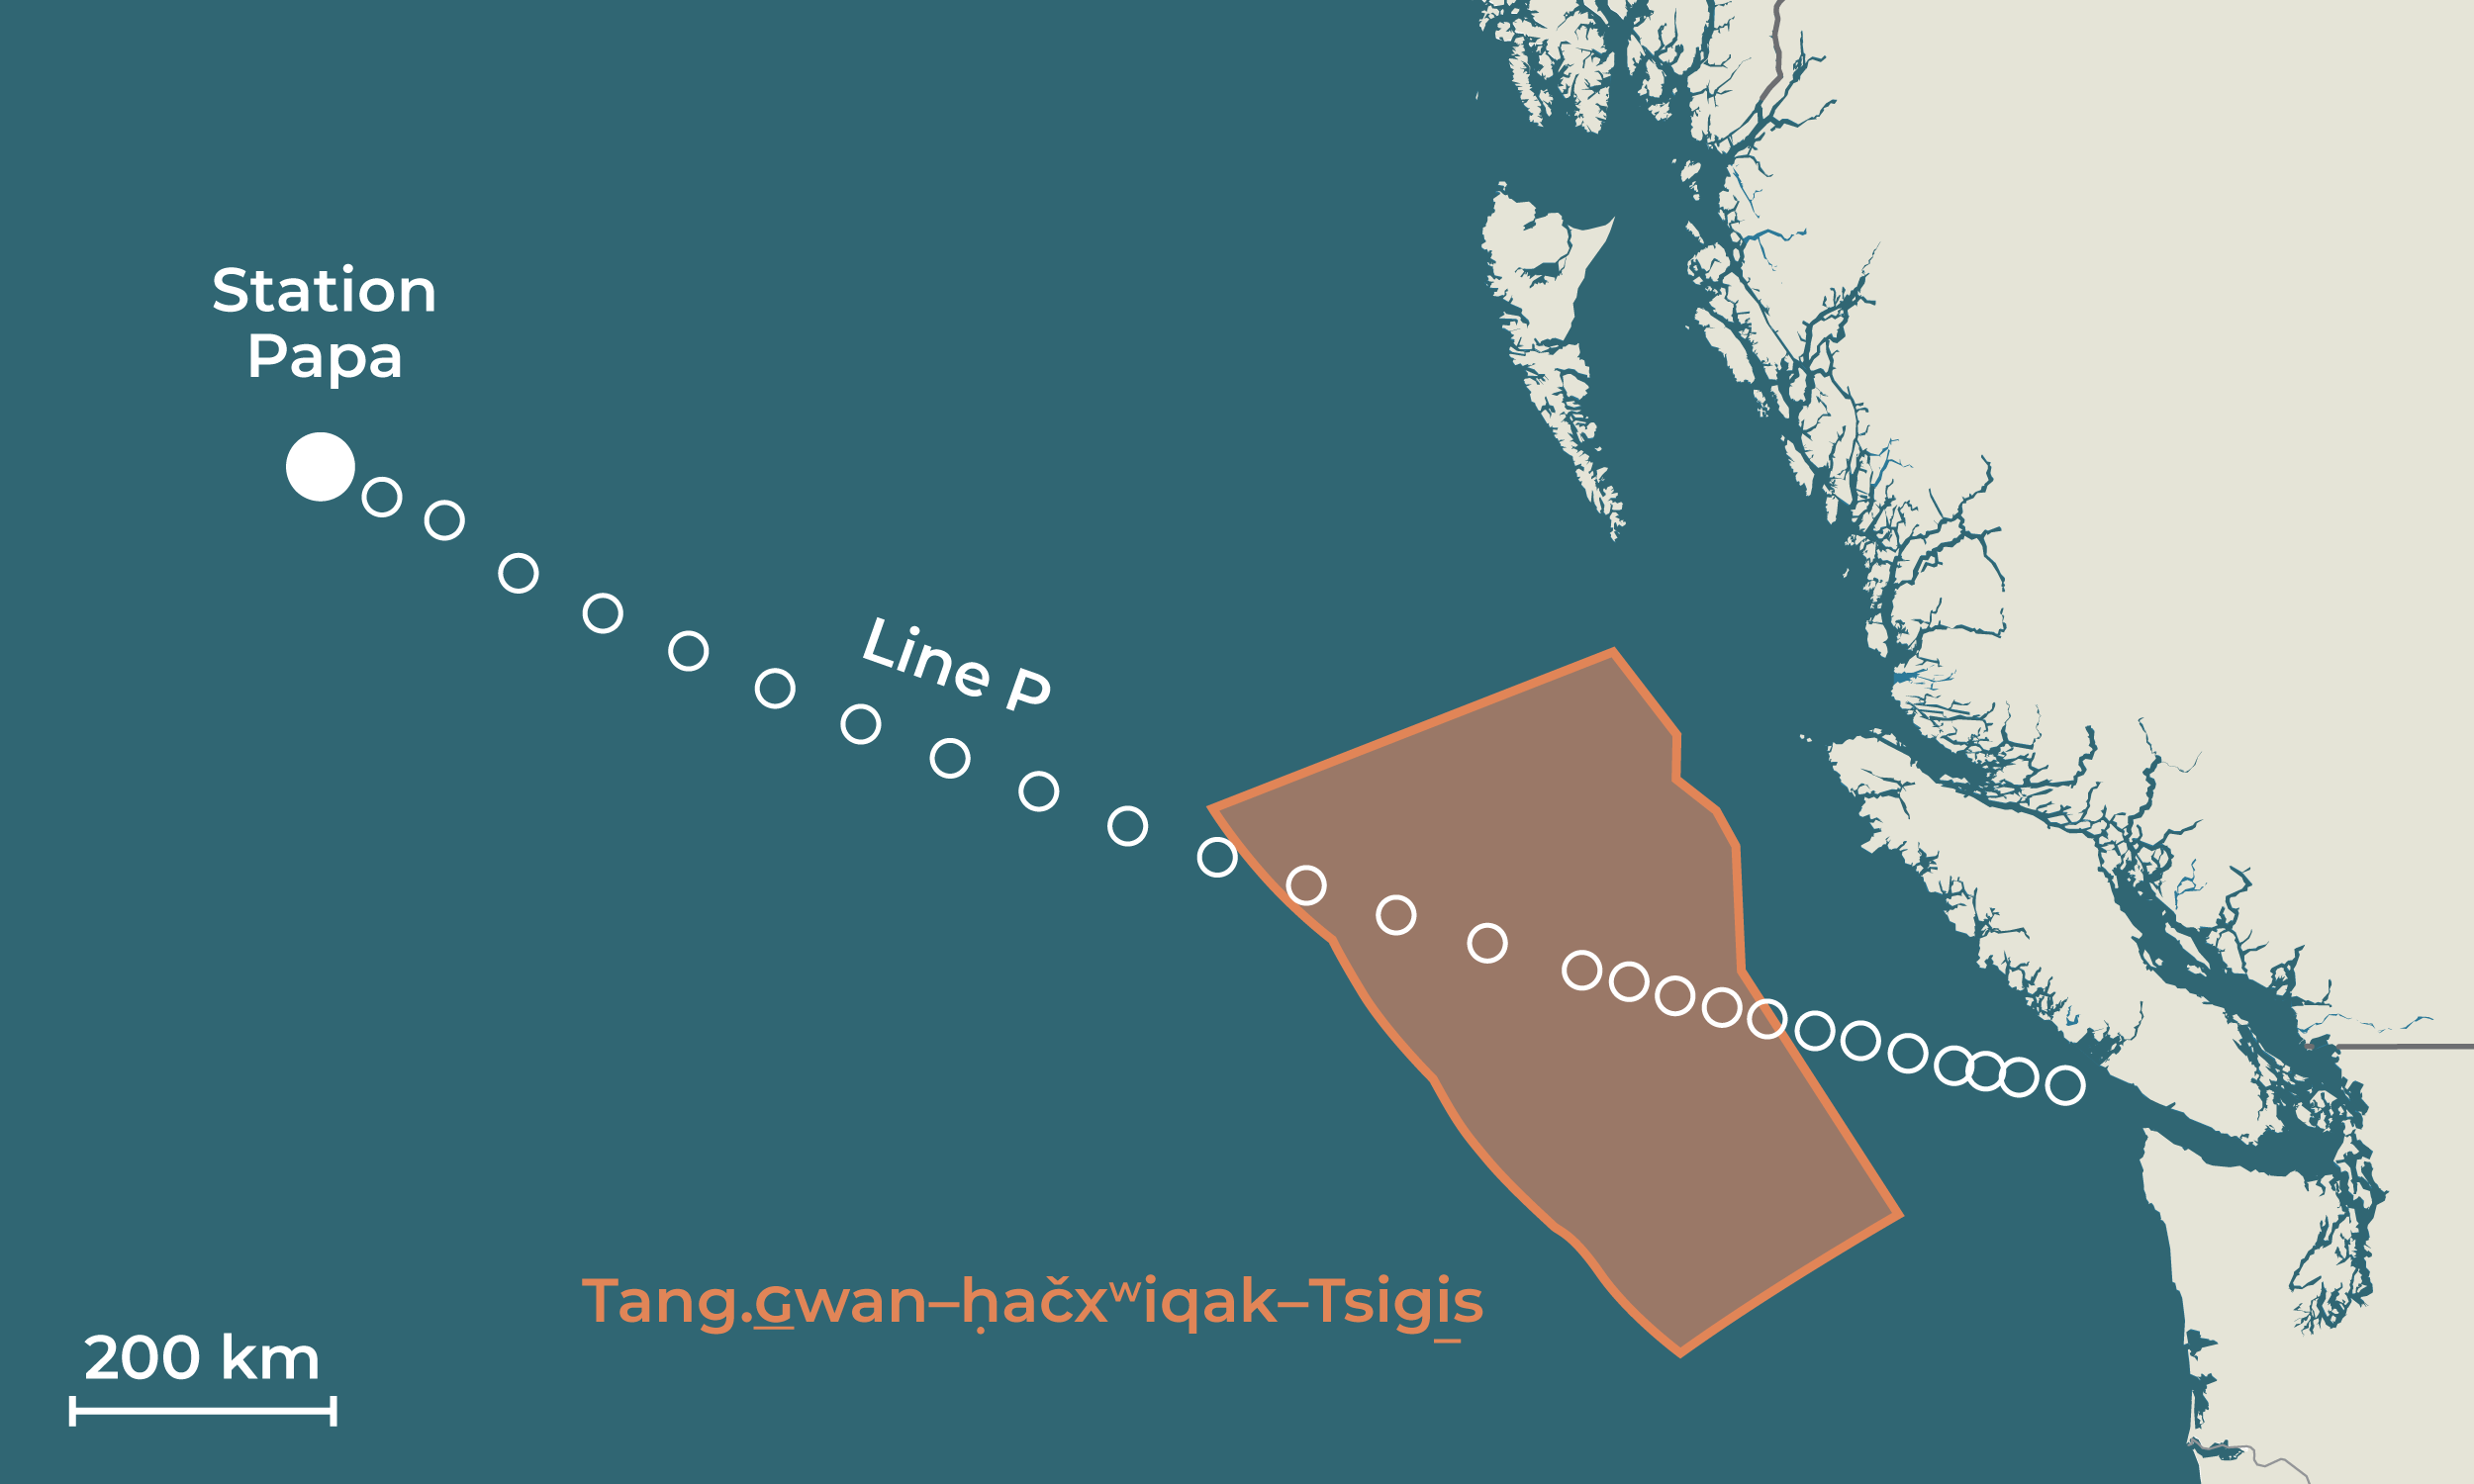
The proposed Tang.ɢwan–ḥačxwiqak–Tsig̱is Marine Protected Area off the British Columbia coast—133,000 square kilometers, roughly the size of the state of New York—is home to seamounts, hydrothermal vents, and rare deep-water organisms. The map also shows the 27 monitoring waypoints of Line P, where research ships have been taking oceanographic measurements for decades. Graphic by Mark Garrison/Hakai Institute
Seamounts serve as a microcosm of climate change impacts on seafloor ecosystems throughout the global ocean.
The drop camera, towed by the Canadian Coast Guard Ship John P. Tully, is specially designed to glide along the shifting contours of the underwater mountain range.
“We watch in real time as the seafloor changes, and we can fly up and down like a yo-yo,” says Cherisse Du Preez, who leads the Deep Sea Ecology Program at Fisheries and Oceans Canada (DFO).
“That’s how we navigate in straight-line transects from the bottom of the seamount up to the top.”
What the camera reveals, however, is unexpected. As Du Preez observes from the ship, she sees that about one-quarter of the bamboo coral forest is dead at a depth between 650 and 700 meters, where it’s expected to thrive.
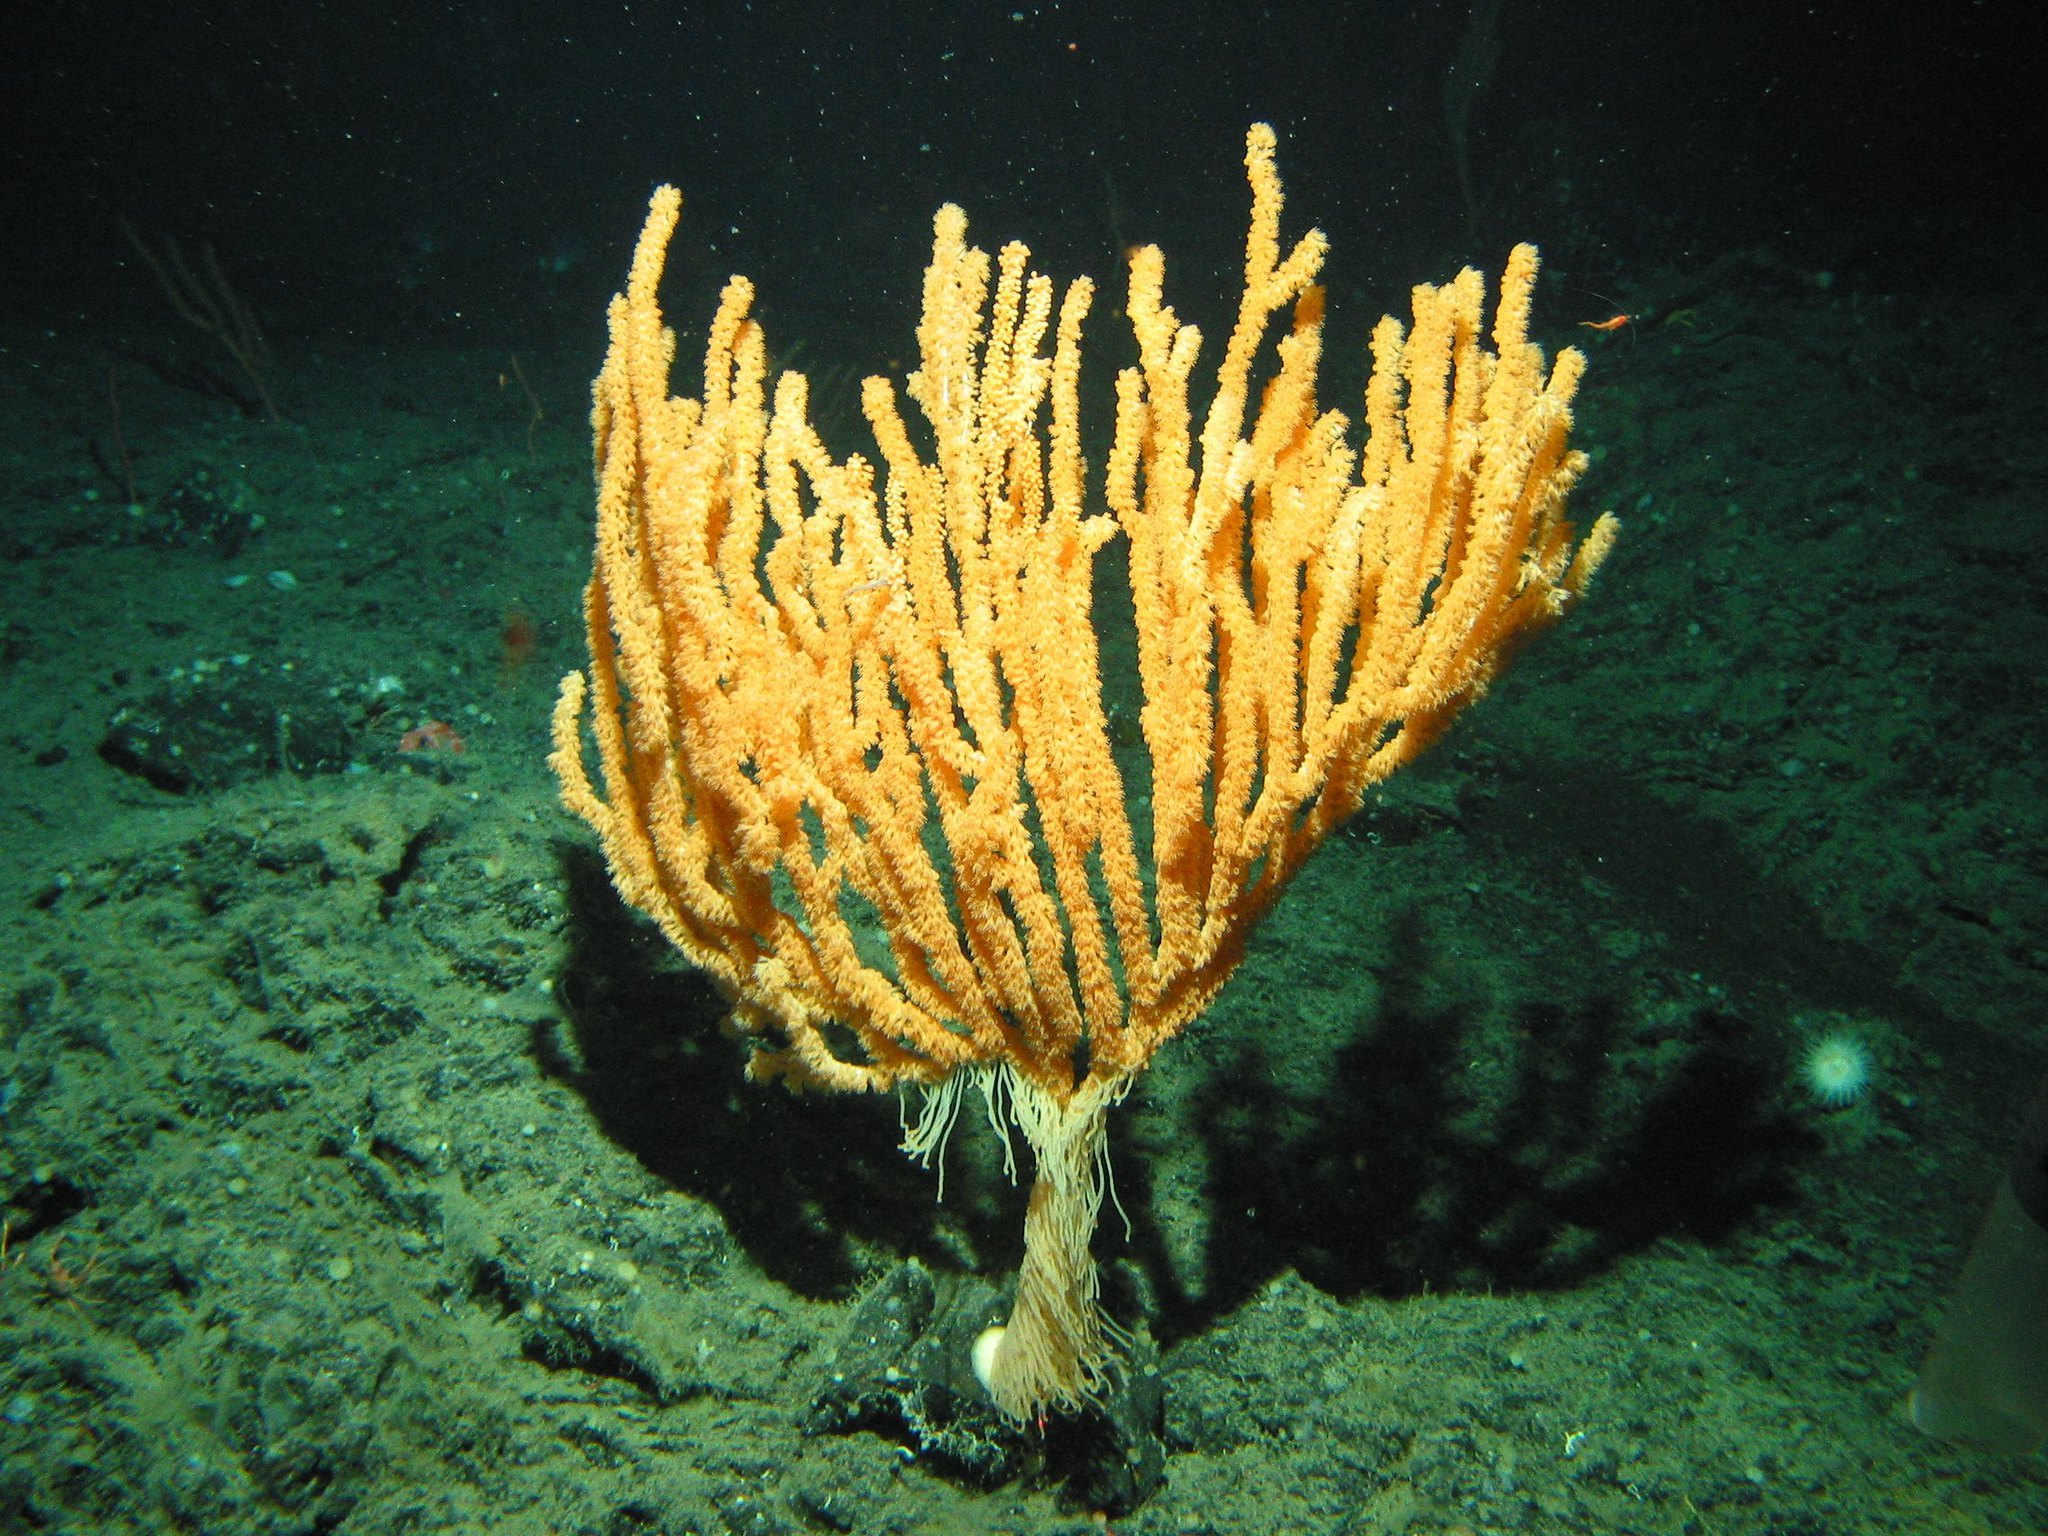
Deep-sea bamboo corals like this one—which can be hundreds of years old—face emerging threats from low-oxygen conditions. Photo courtesy of NOAA Office of Ocean Exploration
The Need to Measure
Du Preez, an ecologist, led a 2017 expedition to the Pacific seamounts focused on observing the effects of rapidly changing conditions on seamount habitats.
Fellow DFO research scientist Tetjana Ross participated from research facilities on shore. She looked at oceanographic and biochemical factors observed during the voyage, such as temperature, dissolved oxygen, and salinity.
Du Preez’s expeditions brought back data from four seamounts that year. She has returned annually since then, examining the health of these deep-sea ecosystems on more than 20 seamounts.
Fisheries and Oceans Canada (DFO) marine ecologist Cherisse Du Preez (left) with colleagues on a deep-sea research expedition. Photo by Shelton Du Preez/Fisheries and Oceans Canada
The bamboo coral observed in 2017 is one of several species—along with brittle stars, sponges, and rockfish—selected by Du Preez as indicators of ecosystem health.
Along with their importance as “habitat-forming” creatures, these organisms are particularly vulnerable to ocean change, in part due to their slow growth rates and limited mobility.
Because the dead bamboo corals that Du Preez observed were still standing, the team ruled out damage from commercial fishing trawlers as the cause of death—suspecting instead that environmental stress was to blame.
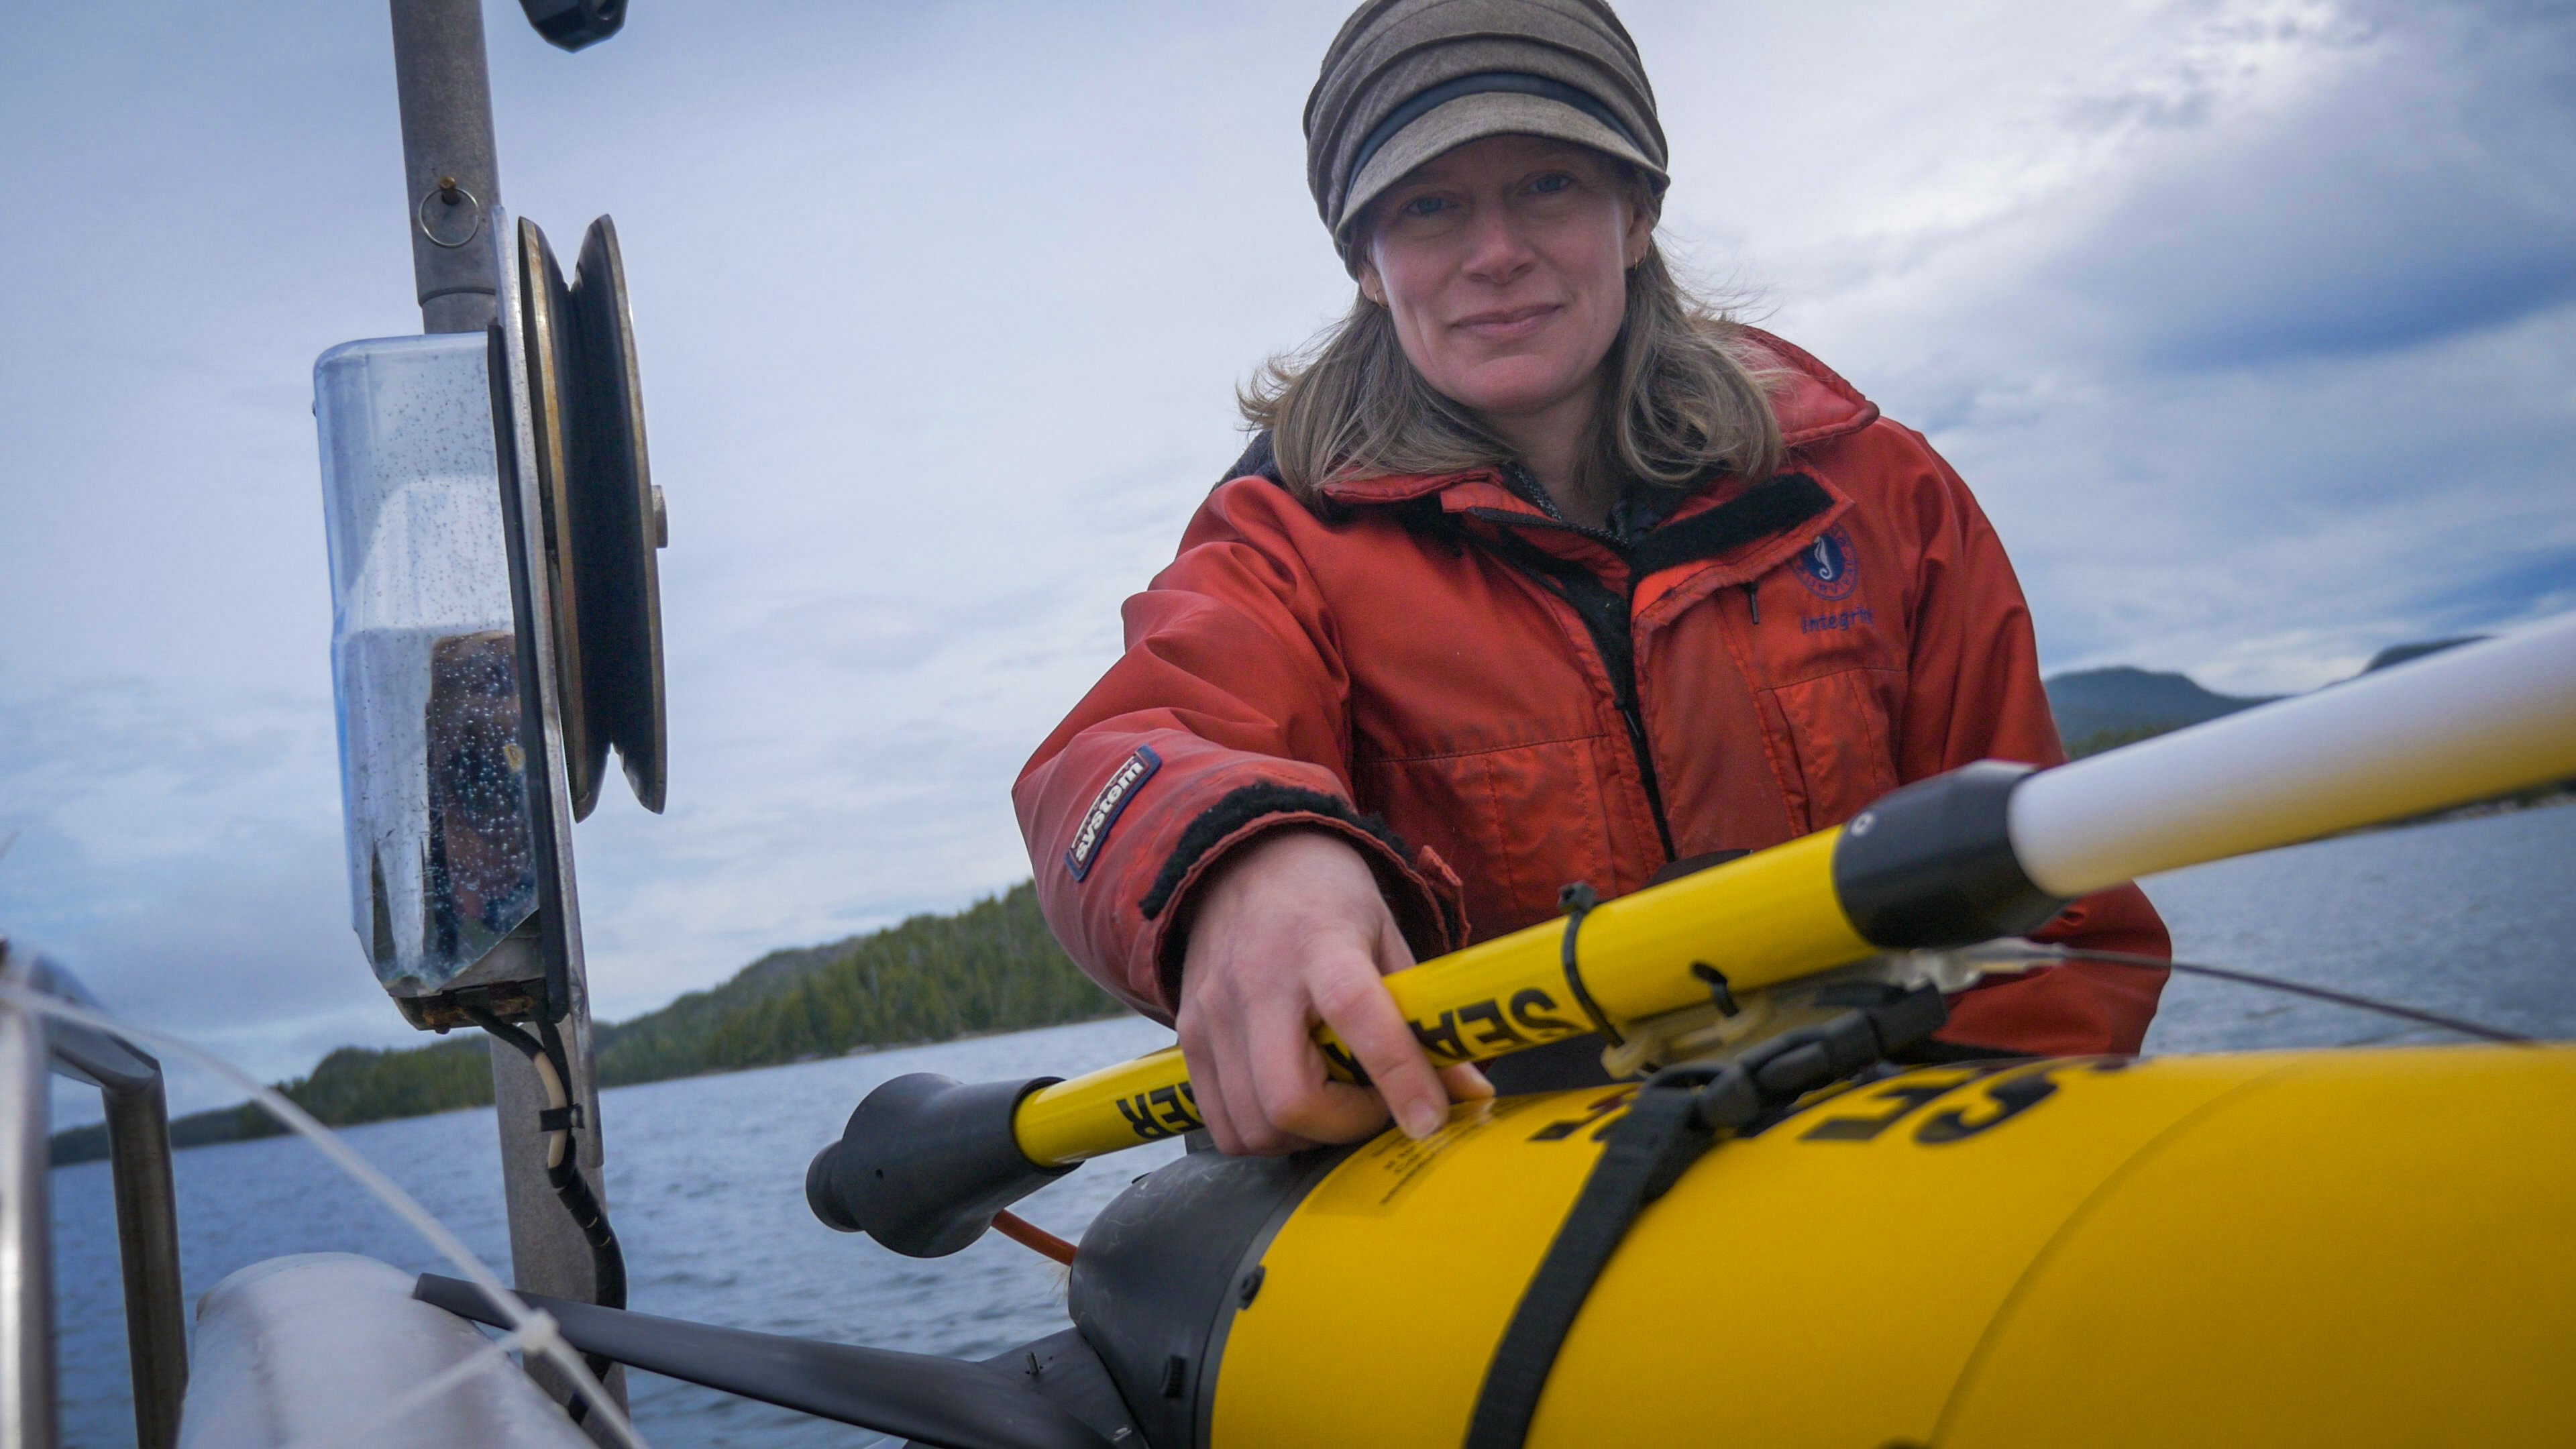
Physical oceanographer Tetjana Ross, also with DFO, prepares a glider for its undersea journey. Photo by Katrina Pyne/Hakai Institute
But what kind of environmental stress? Drawing on the unique data set of long-term deep-sea measurements taken on Line P (see map above), Ross and Du Preez believe a likely factor was hypoxia—a lack of oxygen.
A growing concern in the global ocean, hypoxia is the development of low-oxygen waters that can suffocate living organisms, creating vast dead zones. Not a precise term because tolerance to low levels of dissolved oxygen varies widely among species, hypoxia occurs when levels drop below the thresholds needed to sustain the majority of animal life.
It is particularly deadly for invertebrates like corals, bivalves, crabs, and sea stars that cannot move, or not move with sufficient speed.
Even relatively agile creatures like fish aren’t safe from hypoxic conditions.
At whatever depth they encounter low-oxygen water, fish—whether a marlin, rockfish, or salmon—might be able to swim away.
But hypoxia shrinks habitat ranges, reducing food supply and potentially exposing fish to new predators, or more of them.
Unfortunately, low-oxygen waters are having drastic effects on the Pacific seamounts.
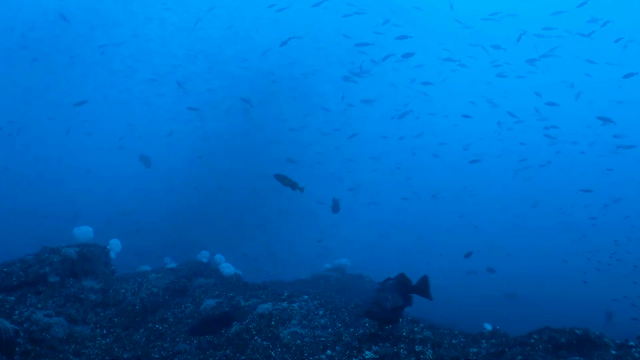
One of the undersea mountains, known as Dellwood, once supported an abundance of rougheye rockfish. But not a single rougheye turned up in seamount observations in 2017 or 2019.
Once abundant on some Pacific seamounts, rougheye rockfish are becoming harder to find. Video courtesy of Northeast Pacific Seamount Expedition Partners and Ocean Exploration Trust
Increasing ocean acidity is also a potential factor in the death of seamount coral, says Ross. A definitive diagnosis will take continued observation—the kind of year-on-year measurements that are invaluable to our understanding of everything from global warming to ocean acidification to hypoxia.
And therein lies the proverbial rub.
Ross’s quantification of long-term changes of oxygen and acidity (pH levels) around the seamounts was made possible by observations along Line P, which is one of the longest-running deep-sea oceanographic time series on the planet.
The farthest point, Ocean Station Papa, was established as a weather station in 1949, with the Line P program tracking some oceanographic measurements by the late 1950s.
“It’s just so valuable,” says Ross of the 65-year data set provided by Line P, which she says was “absolutely essential” to the oceanographic side of the seamount study.
Frank Whitney, a former chief scientist of Line P, was able to look at oxygen data from Station Papa in the early 2000s and see that there was “stunning deoxygenation” over the observation record. This is one example of how Station Papa is a “bellwether for ocean change,” as Whitney puts it.
Slide the arrow to compare the effects of hypoxic water around Pacific seamounts over the past 60 years. Hypoxic and severely hypoxic zones are shown along with the habitat depths of certain species that live among three seamounts: Union, Dellwood, and UN16. Hypoxic water is defined here as less than one milliliter (mL) of O2 per liter (L); severely hypoxic is less than 0.5 mL of O2 per L. Infographic by Mark Garrison, developed from data and source diagram courtesy of Fisheries and Oceans Canada
Meanwhile, climate change is causing the upper layers of the ocean to warm and become less saline in some areas, largely due to melting glacial ice. This is intensifying the typical phenomenon of stratification, where layers develop that resist the typical mixing of surface waters with deeper ocean waters.
Less mixing can mean less transfer of oxygen between layers; it also affects nutrient levels and the abundance of phytoplankton, which in turn affect dissolved oxygen.
These shifts are causing ecosystem changes that we are just beginning to understand. Answers will reveal themselves only with continued monitoring.
“Some people say, ‘Pshaw, monitoring, they’re just measuring the same things over and over. It’s kind of boring,’” says Ross. “But because Line P is there, all these other studies have been made possible. It’s like the old saying, If you build it, they will come.”
You could call this often unsung research “long science,” which is critical to understanding rapidly changing Earth systems. But doing long science—establishing and sustaining data-gathering programs for decades—is an uphill battle for researchers.
Mystery of the Dying Dungeness
Francis Chan remembers a call he got in 2002, not long after he moved to Oregon from the East Coast.
On the line was a biologist from the state’s department of fish and wildlife, conveying “weird observations” from local fishermen.
Dungeness crabs, the prize of a live fishery worth US $72-million in 2020, were coming up dead in their pots.
“The fishermen were telling us, ‘That’s not normal,’” recalls Chan, an ecologist and associate professor at Oregon State University (OSU).
Crabbers aboard the Morningstar II off the Oregon coast examine their catch. Photo by Julia Rosen
Fishermen also reported octopuses climbing their crab ropes, as if trying to escape from lower depths. One of Chan’s colleagues saw unusual numbers of deep-dwelling rockfish and lingcod washing up dead along shorelines, something he’d never seen in 30 years.
It was a mystery.
Chan went back into the vast historical environmental records maintained by the National Oceanic and Atmospheric Administration (NOAA).
There, he uncovered a body of oceanographic data left by scientists who had made patchy but high-quality ship-based measurements for temperature, dissolved oxygen, and other factors.
Taken long before Chan had established his own system of moored testing buoys, most of these observations came from Oregon State University research cruises.
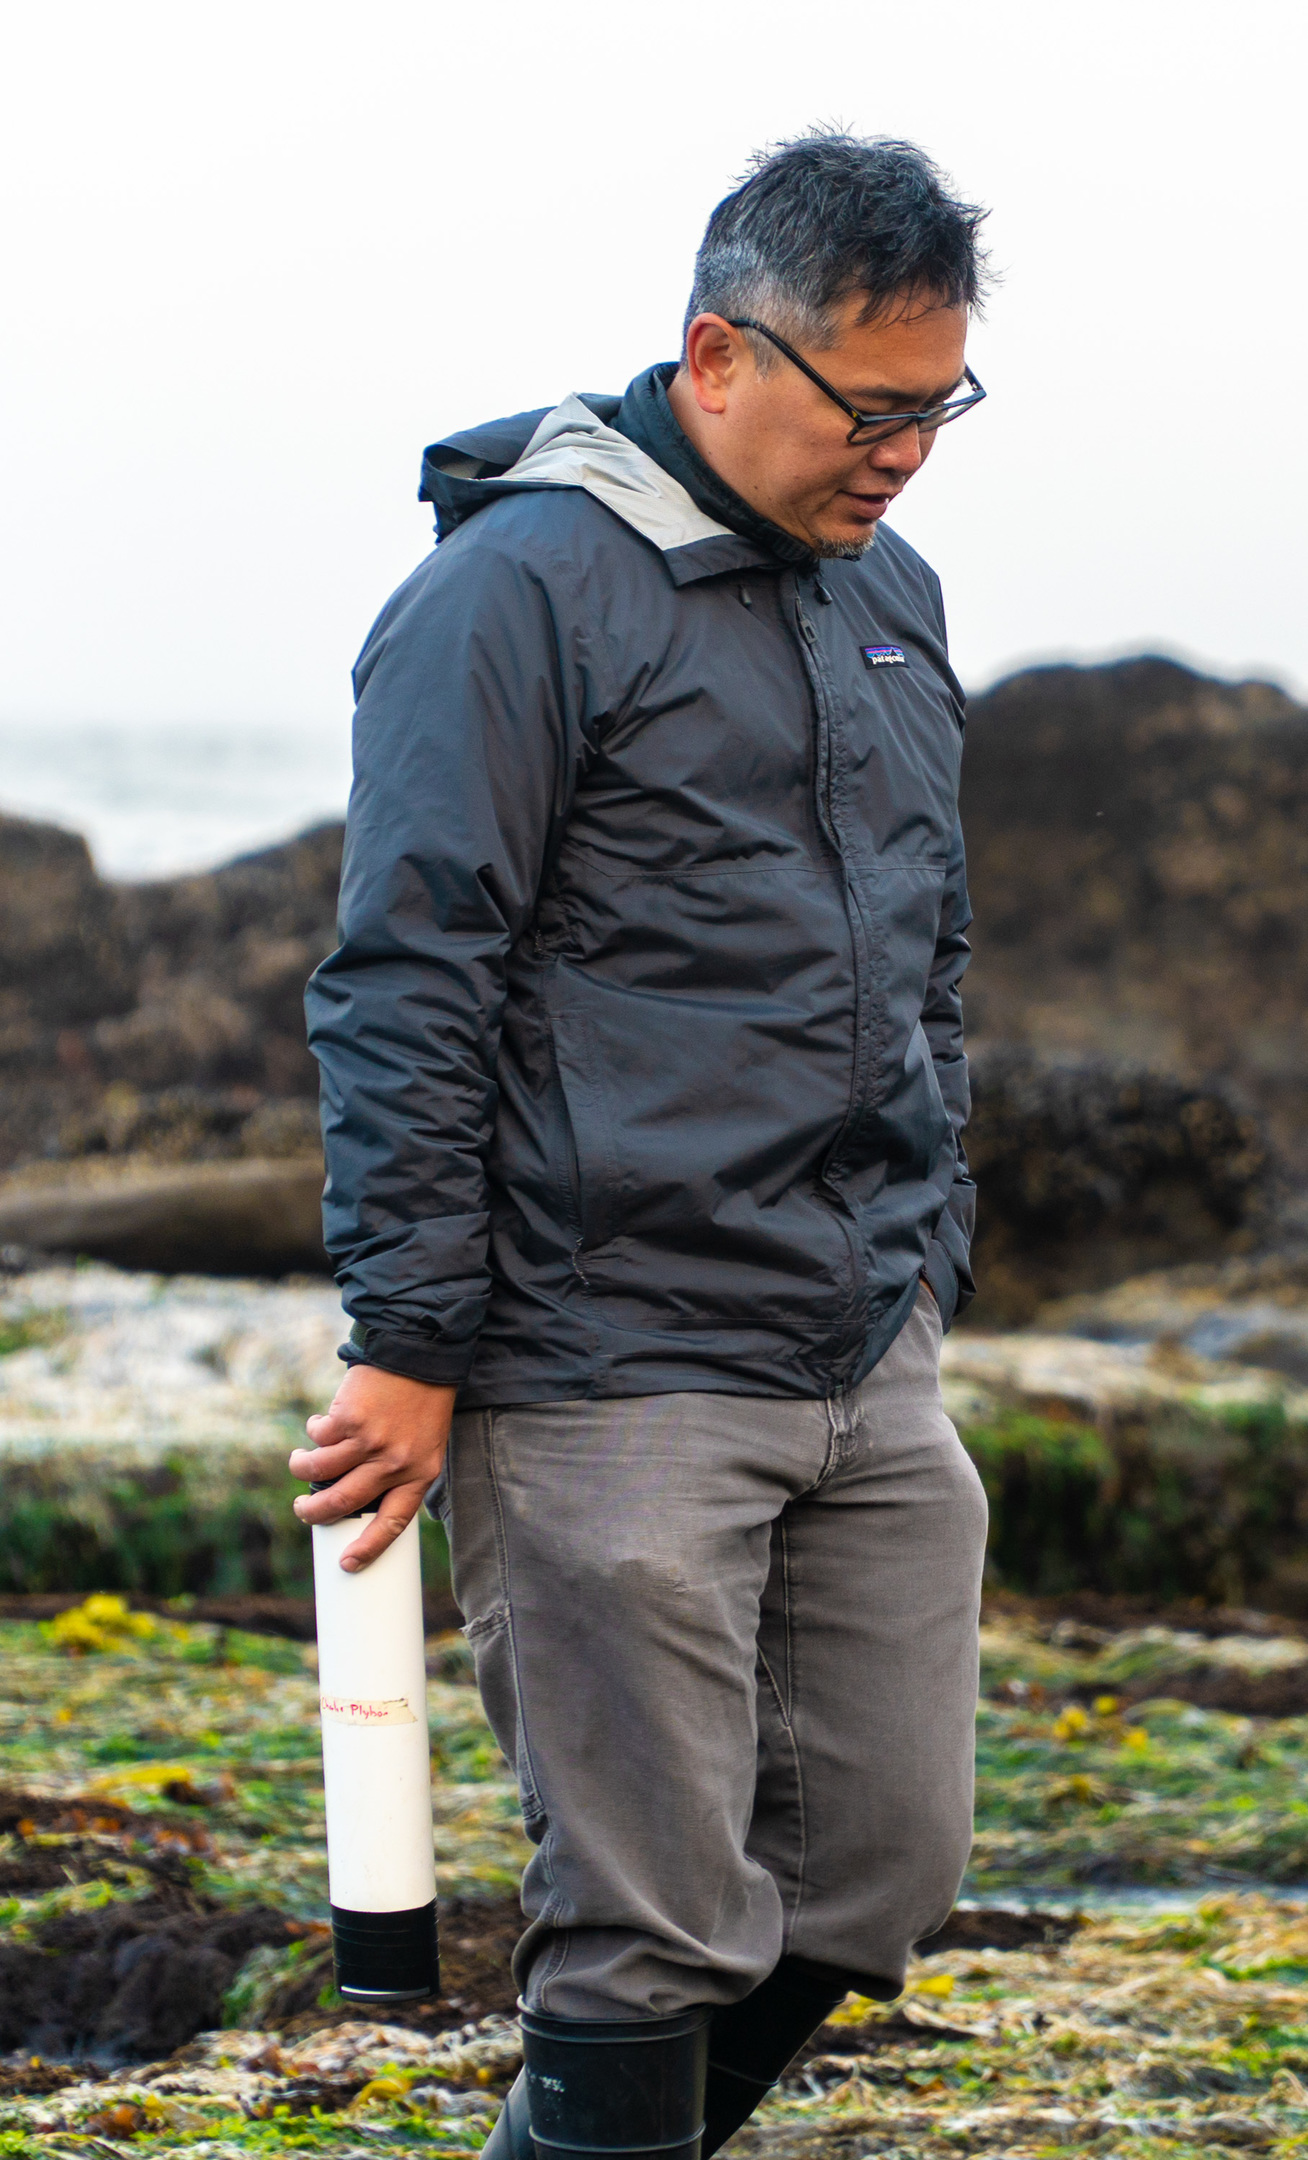
Oregon State University ecology professor Francis Chan conducts field research along the Oregon coast, where mysterious die-offs of crabs and bottom fish led to surprising data about hypoxia. Photo courtesy of Oregon State University
Chan plotted all the data he could find for the first five decades of modern oceanography off the Oregon coast. There were more than one million data points.
The cause of the crab die-off, he discovered, was oxygen. Or, rather, the lack of it: another case of hypoxia.
Lower oxygen levels are more commonly seen in the deep waters of the open ocean, but Chan’s team was seeing them only one kilometer offshore, in 15 to 30 meters of water. “We hadn’t seen that anywhere in the historical record.”
In the past 50 years, the ocean has lost approximately two percent of its oxygen, and the amount of seawater completely free of oxygen has increased more than fourfold.
In coastal areas, rising nutrient input from commercial fertilizers, sewage, and other factors is a driver of marine oxygen loss, but the warming of seawater associated with climate change is thought to be the primary culprit behind deoxygenation in the global ocean.
The ocean has borne the brunt of warming caused by industrial civilization and the burning of fossil fuels. Since the early 1970s alone, the ocean has taken up more than 90 percent of the excess heat generated by human activities.
Since the die-offs, Chan has spent two decades monitoring oxygen levels off the Oregon coast. For years, commercial crabbers were asking him where the lowest-oxygen waters were located, so they could avoid fishing there. This gave Chan an idea: “We thought, What if they could make the measurements themselves?”
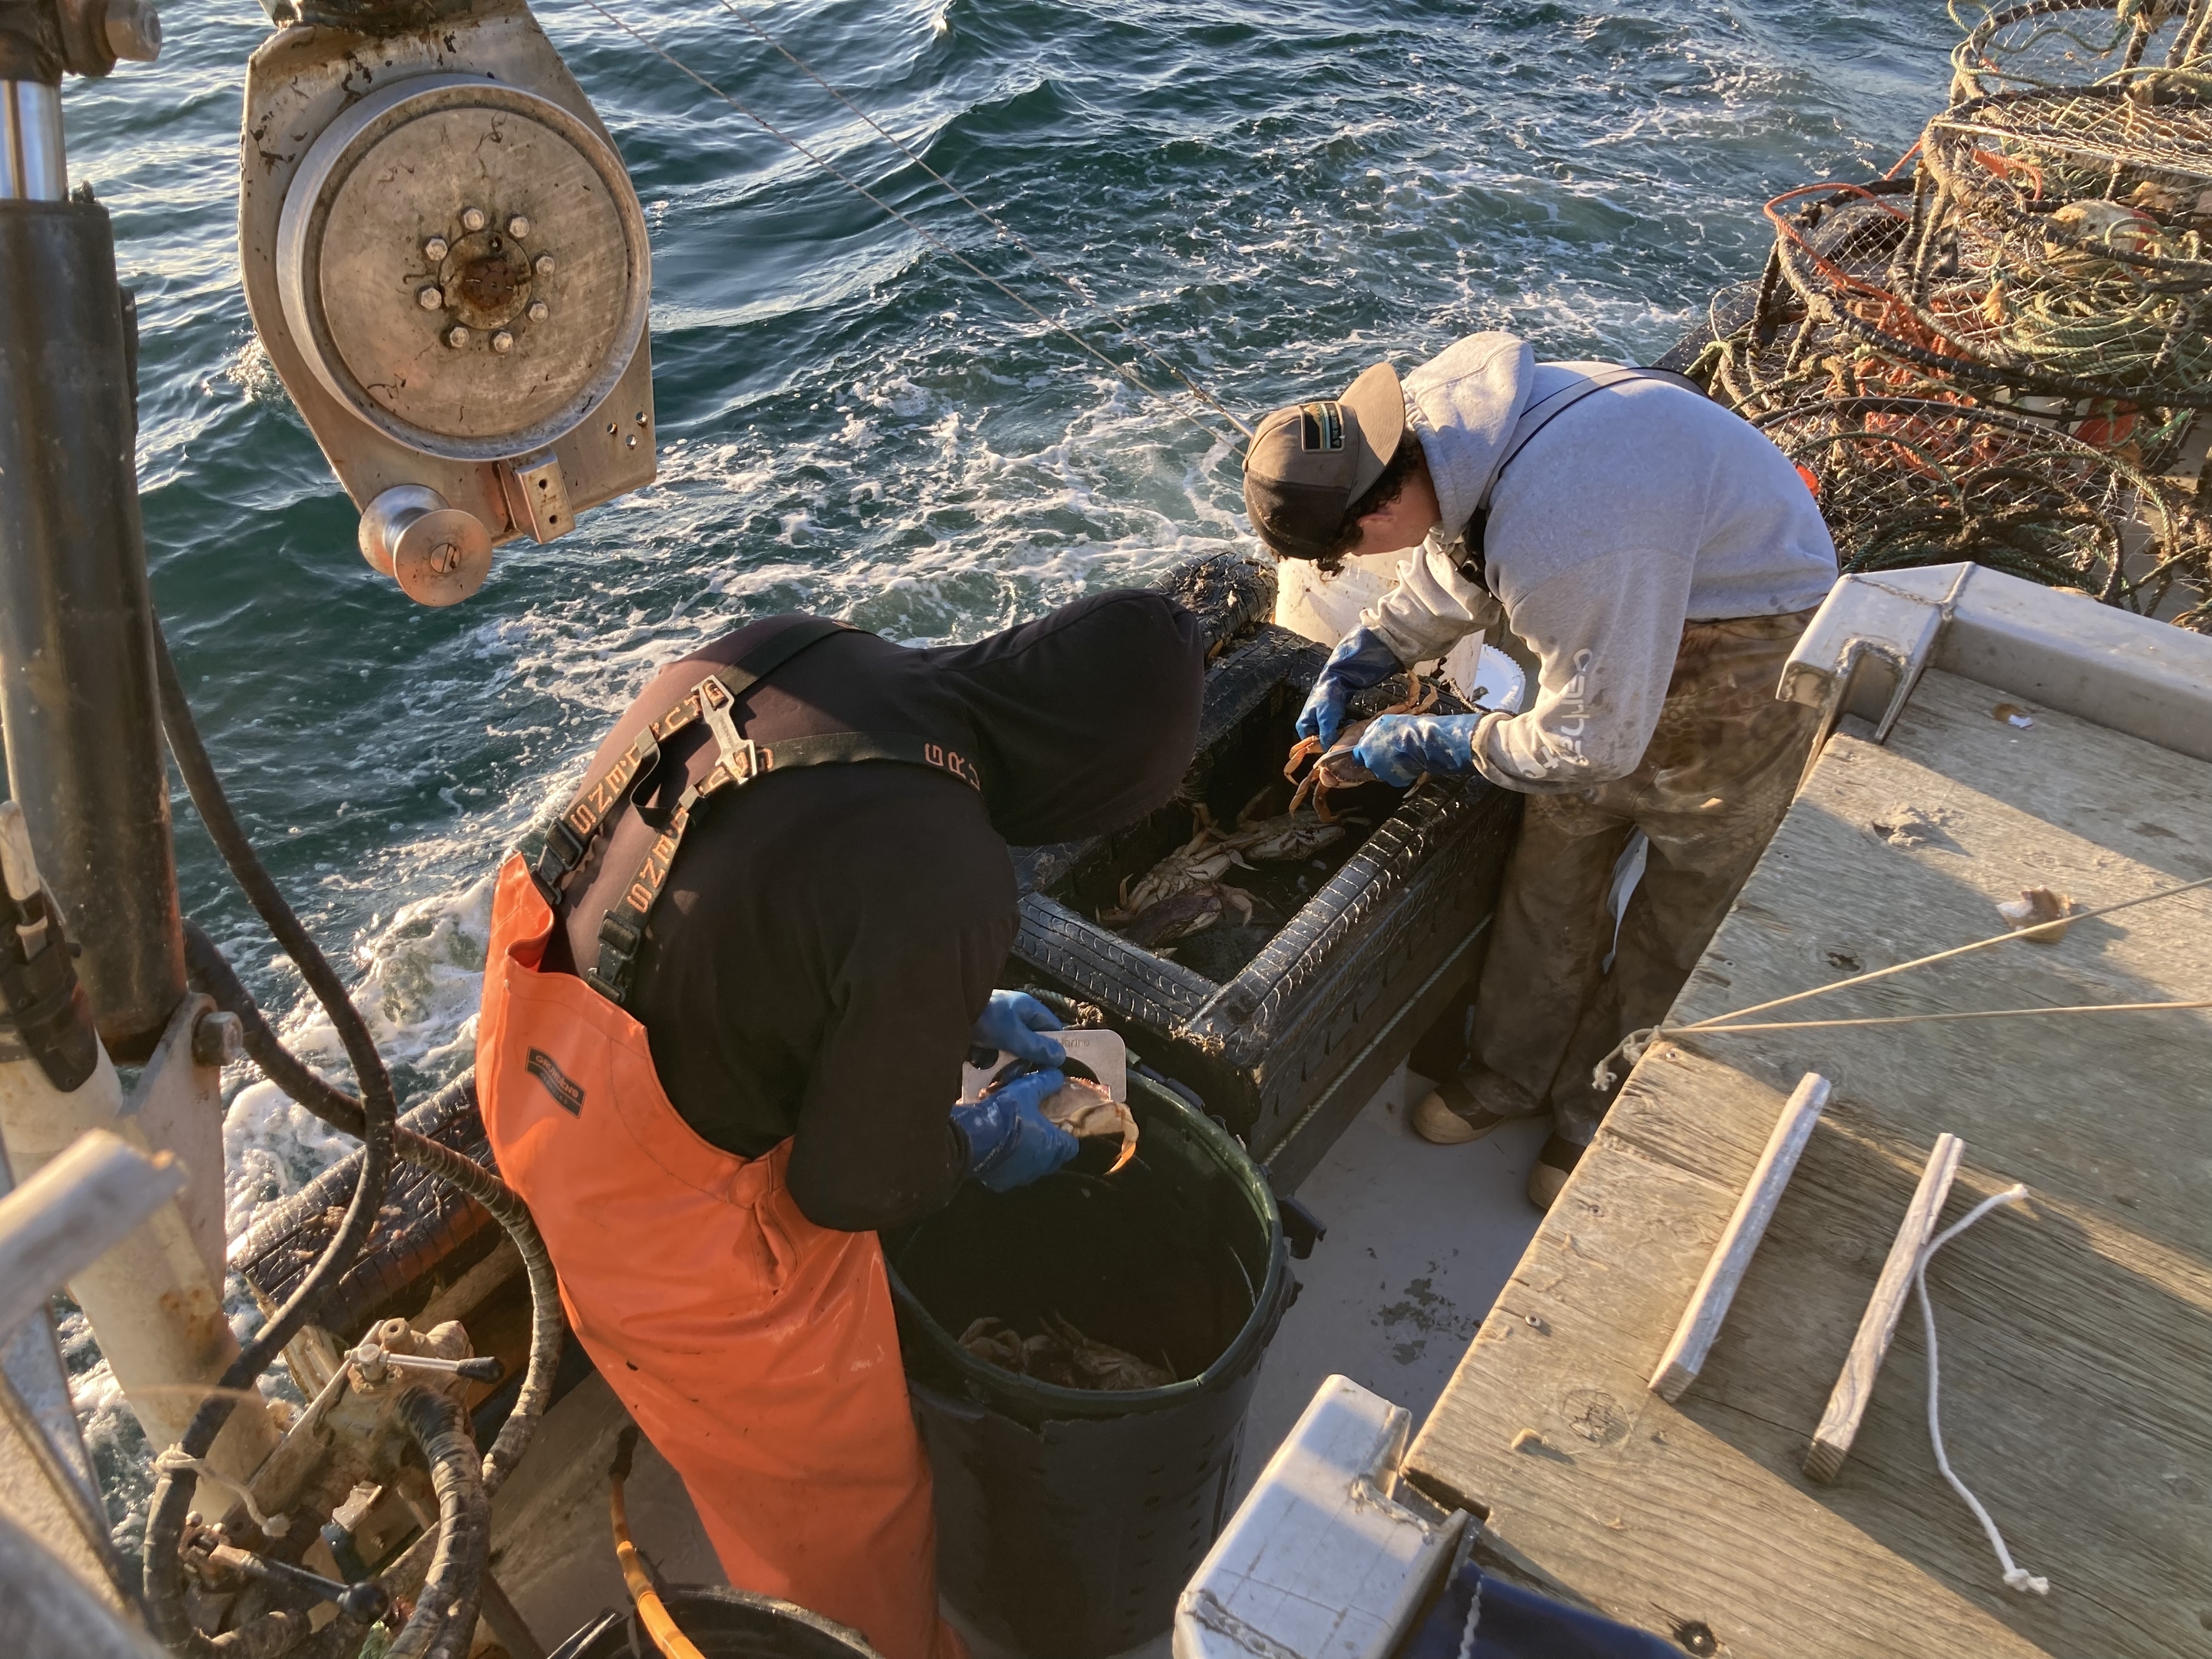
Oregon crabbers sort and measure a haul of Dungeness crabs. The crew of this boat has deployed sensors in traps to detect low-oxygen waters. Photo by Julia Rosen
Since 2020, Oregon crabbers have been using sensors in their traps to collect data on dissolved oxygen and water temperature. They are the first to see the measurements, which are then uploaded to the cloud for scientists like Chan.
Action plans to respond to ocean acidification and hypoxia have now been established in Washington and Oregon, and a British Columbia ocean acidification and hypoxia action plan will be launched soon, endorsed by the United Nations Decade of Ocean Science for Sustainable Development.
Chan was closely involved in establishing Oregon’s action plan, which includes a goal to invest in the state’s existing research sites, tools, and monitoring efforts.
Chan says long-term regional collaboration will be critical for the future. Conditions in British Columbia, for example, contribute to conditions in Oregon, he adds, noting that British Columbia, Oregon, and Washington share much of the same marine life, from Dungeness crabs to whales.
“Solutions that one region comes up with are very likely to be transferable,” Chan says. “We are sending our dissolved oxygen sensors to Washington State fishermen now.”
Chan’s technology partner has also provided the same monitoring devices to collaborators in Cape Cod, Massachusetts, including lobster fishermen, since seasonal hypoxia is beginning to be observed there as well.
The Darwin Dilemma
The challenges facing long science are legion. Talented researchers are often attracted to more charismatic fare that promises a media spotlight.
Funding tends to go to projects with definitive outcomes, or to those that promise marketable new technologies or splashy coverage, rather than an understanding of the fundamentals underlying Earth’s complex systems.
“Monitoring is science’s Cinderella, unloved and poorly paid,” wrote Euan Nisbet, a professor emeritus of earth sciences at England’s University of London, in a 2007 commentary in Nature.
“Sustaining a long-term, ground-based program that demands high analytical standards remains challenging,” he continued. “Monitoring does not win glittering prizes. Publication is difficult, infrequent, and unread.”
A researcher departs the Clean Air Sector Laboratory (CASLab) in Antarctica. Part of the Methane Observations and Yearly Assessments research consortium, CASLab specializes in measuring air and snow chemistry. Photo courtesy of British Antarctic Survey
Nisbet’s essay was released on the 50th anniversary of the establishment of Charles David Keeling’s famous carbon dioxide measurement program at the Mauna Loa Observatory in Hawai‘i.
Nisbet himself has a keen interest in atmospheric measurement: he led the multiyear Methane Observations and Yearly Assessments consortium, a UK-based effort started in 2016 to study global methane. The project employed airborne-, ship-, and station-based greenhouse gas–monitoring methods from the Arctic to the Antarctic.
The situation facing researchers has not changed since his 2007 critique, Nisbet says. In his words, the challenges to those trying to gather critical data measurements on land, air, and sea remain “very severe.”
National agencies that fund a large portion of global scientific research tend to cherry-pick proposals that promise exciting breakthroughs.
“They’re particularly biased by hypothesis testing,” says Nisbet, “so if you have a good hypothesis and ways of testing it, and it looks exciting, they’ll fund it.”
To illustrate the challenges of pure discovery science, Nisbet offers an imaginary historical conversation to make his point:
Science Committee: Hey, Mr. Darwin, you’re going to sail around the world for three years. What hypothesis are you going to test?
Darwin: I haven’t a clue.
Science Committee: What are you going to deliver?
Darwin: I don’t know yet.
Science Committee: Sorry. You’re not going to get funded.
Despite the challenges, there are more than 340 ship-based data-gathering programs in the ocean basins of the world. As the growing phenomena of marine hypoxia and ocean acidification demonstrate, both of which pose critical issues for commercial fisheries and ecosystem management, the rapidly changing conditions brought on by global warming make these monitoring initiatives more important than ever.
Even with financial support from governments and organizations, scientists face other pressures in delivering research. And without a continuing stream of baseline data, researchers and policymakers operate blind, unable to contextualize the changes humanity is grappling with in the ocean and beyond.
When funds are available, time limits can hinder longevity. Federal funding agencies like the National Science Foundation in the United States and the Natural Sciences and Engineering Research Council of Canada typically support studies—undertaken by university researchers—on short cycles of three to five years.
For researchers to receive further funding, they need to gain success within those time frames, leaving long-science projects out in the cold. Faculty researchers are rewarded with promotions based on grants, awards, and publications, so a publication based on long-term monitoring that may take 10 or 20 years to produce is a nonstarter in most cases.
“You need a really long-term commitment, and that’s not within the scope of most academic projects,” says Jennifer Jackson, a physical oceanographer and section head of ocean modeling and predictions at DFO.
Jackson notes that the work of former University of British Columbia (UBC) physical oceanographer George Pickard in monitoring BC fjords is “an absolute exception.” Pickard’s work at UBC created a data set spanning more than 25 years, from 1951 to 1978.
The obstacles and challenges facing long science can be intimidating, but the rewards are lasting—and fundamental to tackling the most pressing issues facing humanity. Probably no case illustrates this more clearly than the story behind the Keeling Curve at the Mauna Loa Observatory.
Preserving the Curve: Sputnik, Thatcher, and a “Sleeping Beauty”
The specter of global warming started to haunt the public consciousness in the 1980s.
The steady rise of atmospheric carbon dioxide (CO2)—the primary driver of climate change—became known to scientists as the Keeling Curve.
The story of the curve began in 1958 when Charles David Keeling started monitoring atmospheric data from a 3,395-meter-high observatory on the Mauna Loa volcano, the second-tallest mountain in Hawai‘i.
The Mauna Loa Observatory in Hawai‘i, located at an elevation of 3,395 meters, has provided the foundation for our understanding of the link between carbon emissions and global warming. The observatory was temporarily abandoned in November 2022 due to lava flows from the Mauna Loa volcano, which buried parts of the access road in lava up to nine meters deep. Photo by Sami Sarkis/Alamy Stock Photo
The Keeling Curve would become the longest continuous record of atmospheric CO2—a data set that has documented a rise from 315 parts per million (ppm) CO2 at the outset of the project to more than 422 ppm by April 2023.
Keeling’s work correlated the rise of CO2 with the burning of fossil fuels, confirming the theory of anthropogenic global warming that was posed in the 19th century.
It’s difficult to overstate the importance of his research: prior to Keeling’s investigations, we didn’t know if CO2 from burning fossil fuels would accumulate in the atmosphere or be fully absorbed by the ocean and vegetation on land.
“Tycho Brahe’s observations of planets laid the foundation for Sir Isaac Newton’s theory of gravitation,” said Scripps Institution of Oceanography director Charles F. Kennel in a 2005 obituary for Keeling.
“Albert Michelson’s measurements of the speed of light laid the foundation for Albert Einstein’s theory of relativity. Charles David Keeling’s measurements of the global accumulation of carbon dioxide in the atmosphere set the stage for today’s profound concerns about climate change.”
In 1958, Charles David Keeling began a monitoring study that has grown into the longest continuous record of atmospheric carbon dioxide (CO2). The data set, called the Keeling Curve, has documented a rise from 315 parts per million (ppm) CO2 in 1958 to more than 422 ppm by April 2023, confirming the theory of anthropogenic global warming that was posed back in the 19th century. Graphic by Mark Garrison, based on data from the National Oceanic and Atmospheric Administration
What is less recognized, however, is what it took for his program to survive, and how some of his most brilliant research was ignored for decades.
A chemist by training, Keeling was dedicated to long-term monitoring. He refused to take only snapshots of CO2 concentrations every few years or every decade, arguing in favor of daily observations.
But his work was always under threat. The Mauna Loa atmospheric monitoring was almost mothballed in 1963, and only the so-called Sputnik Shock of the Cold War—when the Russians successfully launched the first satellite into space—sparked a boost in American spending on all things science, including the Hawaiian monitoring.
By the early 1990s, under the presidency of George H. W. Bush, the US government was again on the verge of closing the monitoring program at Mauna Loa. According to Euan Nisbet, former British prime minister Margaret Thatcher helped to save it. An Oxford chemist by training, Thatcher was convinced of the project’s great value and added her voice to a campaign to ensure it was preserved.
For decades, much of Keeling’s work was under-cited by other researchers and underappreciated in general society. His seminal 1960 paper that identified the Keeling Curve was what researchers sometimes call a “sleeping beauty”—research that is published but ignored for long periods until it’s resuscitated by a resourceful contemporary researcher.
Recognition took almost four decades, but by 1995, Keeling’s publications were cited around 100 times by fellow academics; by 2020, annual citations had grown sixfold.
There are many Keeling-esque data champions in disciplines of all sorts, scientific rebels who persist via willpower, schmoozing, and endless rounds of proposals to keep their long-science projects alive.
“
Sustained ocean time series are critical for characterizing marine ecosystem shifts in a time of accelerating, and at times unpredictable, changes. They represent the only means to distinguish between natural and anthropogenic forcings, and are the best tools to explore causal links and implications for human communities that depend on ocean resources.”
—Heather Benway et al., Ocean Time Series Observations of Changing Marine Ecosystems
Our awareness of rising hypoxia in the Gulf of St. Lawrence, for instance, is thanks to oxygen data gathered by a chemist named Alexandre Vachon.
Vachon started doing his own measurements from a rowboat between 1931 and 1934 during restless visits to the Station Biologique du Saint-Laurent in the village of Trois-Pistoles, Quebec.
Likewise, many other gifted scientists breathe new life into old research. George Pickard’s work extracting precise oceanographic data from British Columbia’s fjords was not well recognized until a Hakai Institute team led by Jennifer Jackson brought it to light while investigating the 2014–2016 marine heatwaves in Rivers Inlet.
Along with data gathered by the Hakai Institute and DFO, Pickard’s effort now forms the backbone of a 70-plus-year time series that’s expanding what we know about historical conditions for large stretches of the BC coast.
The other major time series in this part of the world requires researchers to voyage more than 1,000 kilometers offshore.
Line P: An Ocean of Knowledge
Line P began with a single point called Ocean Station Papa.
Located approximately 1,500 kilometers off the coast of Vancouver Island, British Columbia, Station Papa was established by the US Coast Guard in 1949 at a place routinely battered by rough weather.
In the pre-satellite era, the location was a prime site to better understand conditions affecting aviation and to provide warning of brewing storms. Canada assumed full responsibility for Station Papa in 1950.
The Canadian Coast Guard vessel John P. Tully heads out to sea from Vancouver Island, British Columbia. Photo by Shelton Du Preez/Fisheries and Oceans Canada
Operating the site meant stationing a single ship, in many cases a refitted former naval vessel, for six weeks at a time, often amid appalling seasonal weather.
By 1981, the stationary ships were removed, partly because of the advent of satellite-based data and partly, in the words of oceanographer Howard Freeland, “as a contribution to government austerity.”
DFO ships began gathering information during their voyages to Station Papa, resulting in 12 data collection stations, which eventually expanded to the present total of 27 that make up the line. Line P research now comprises one of the world’s longest oceanographic time series.
Frank Whitney, a chief scientist on Line P from 1992 to 2006, sailed many times to Station Papa. He remembers “ugly” winter cruises with 90-kilometer-per-hour winds and massive swells, which can reach heights over 12 meters in the area. Cabin B on the main deck became known as Cabin Barf.
“The ship would sort of plunge into the ocean and waves would break over the foredeck,” Whitney recalls. “Those are the memories that you try to block out. You could do no more than hold the ship directly into the wind and ride the storm out, and the ship would go absolutely nowhere.”
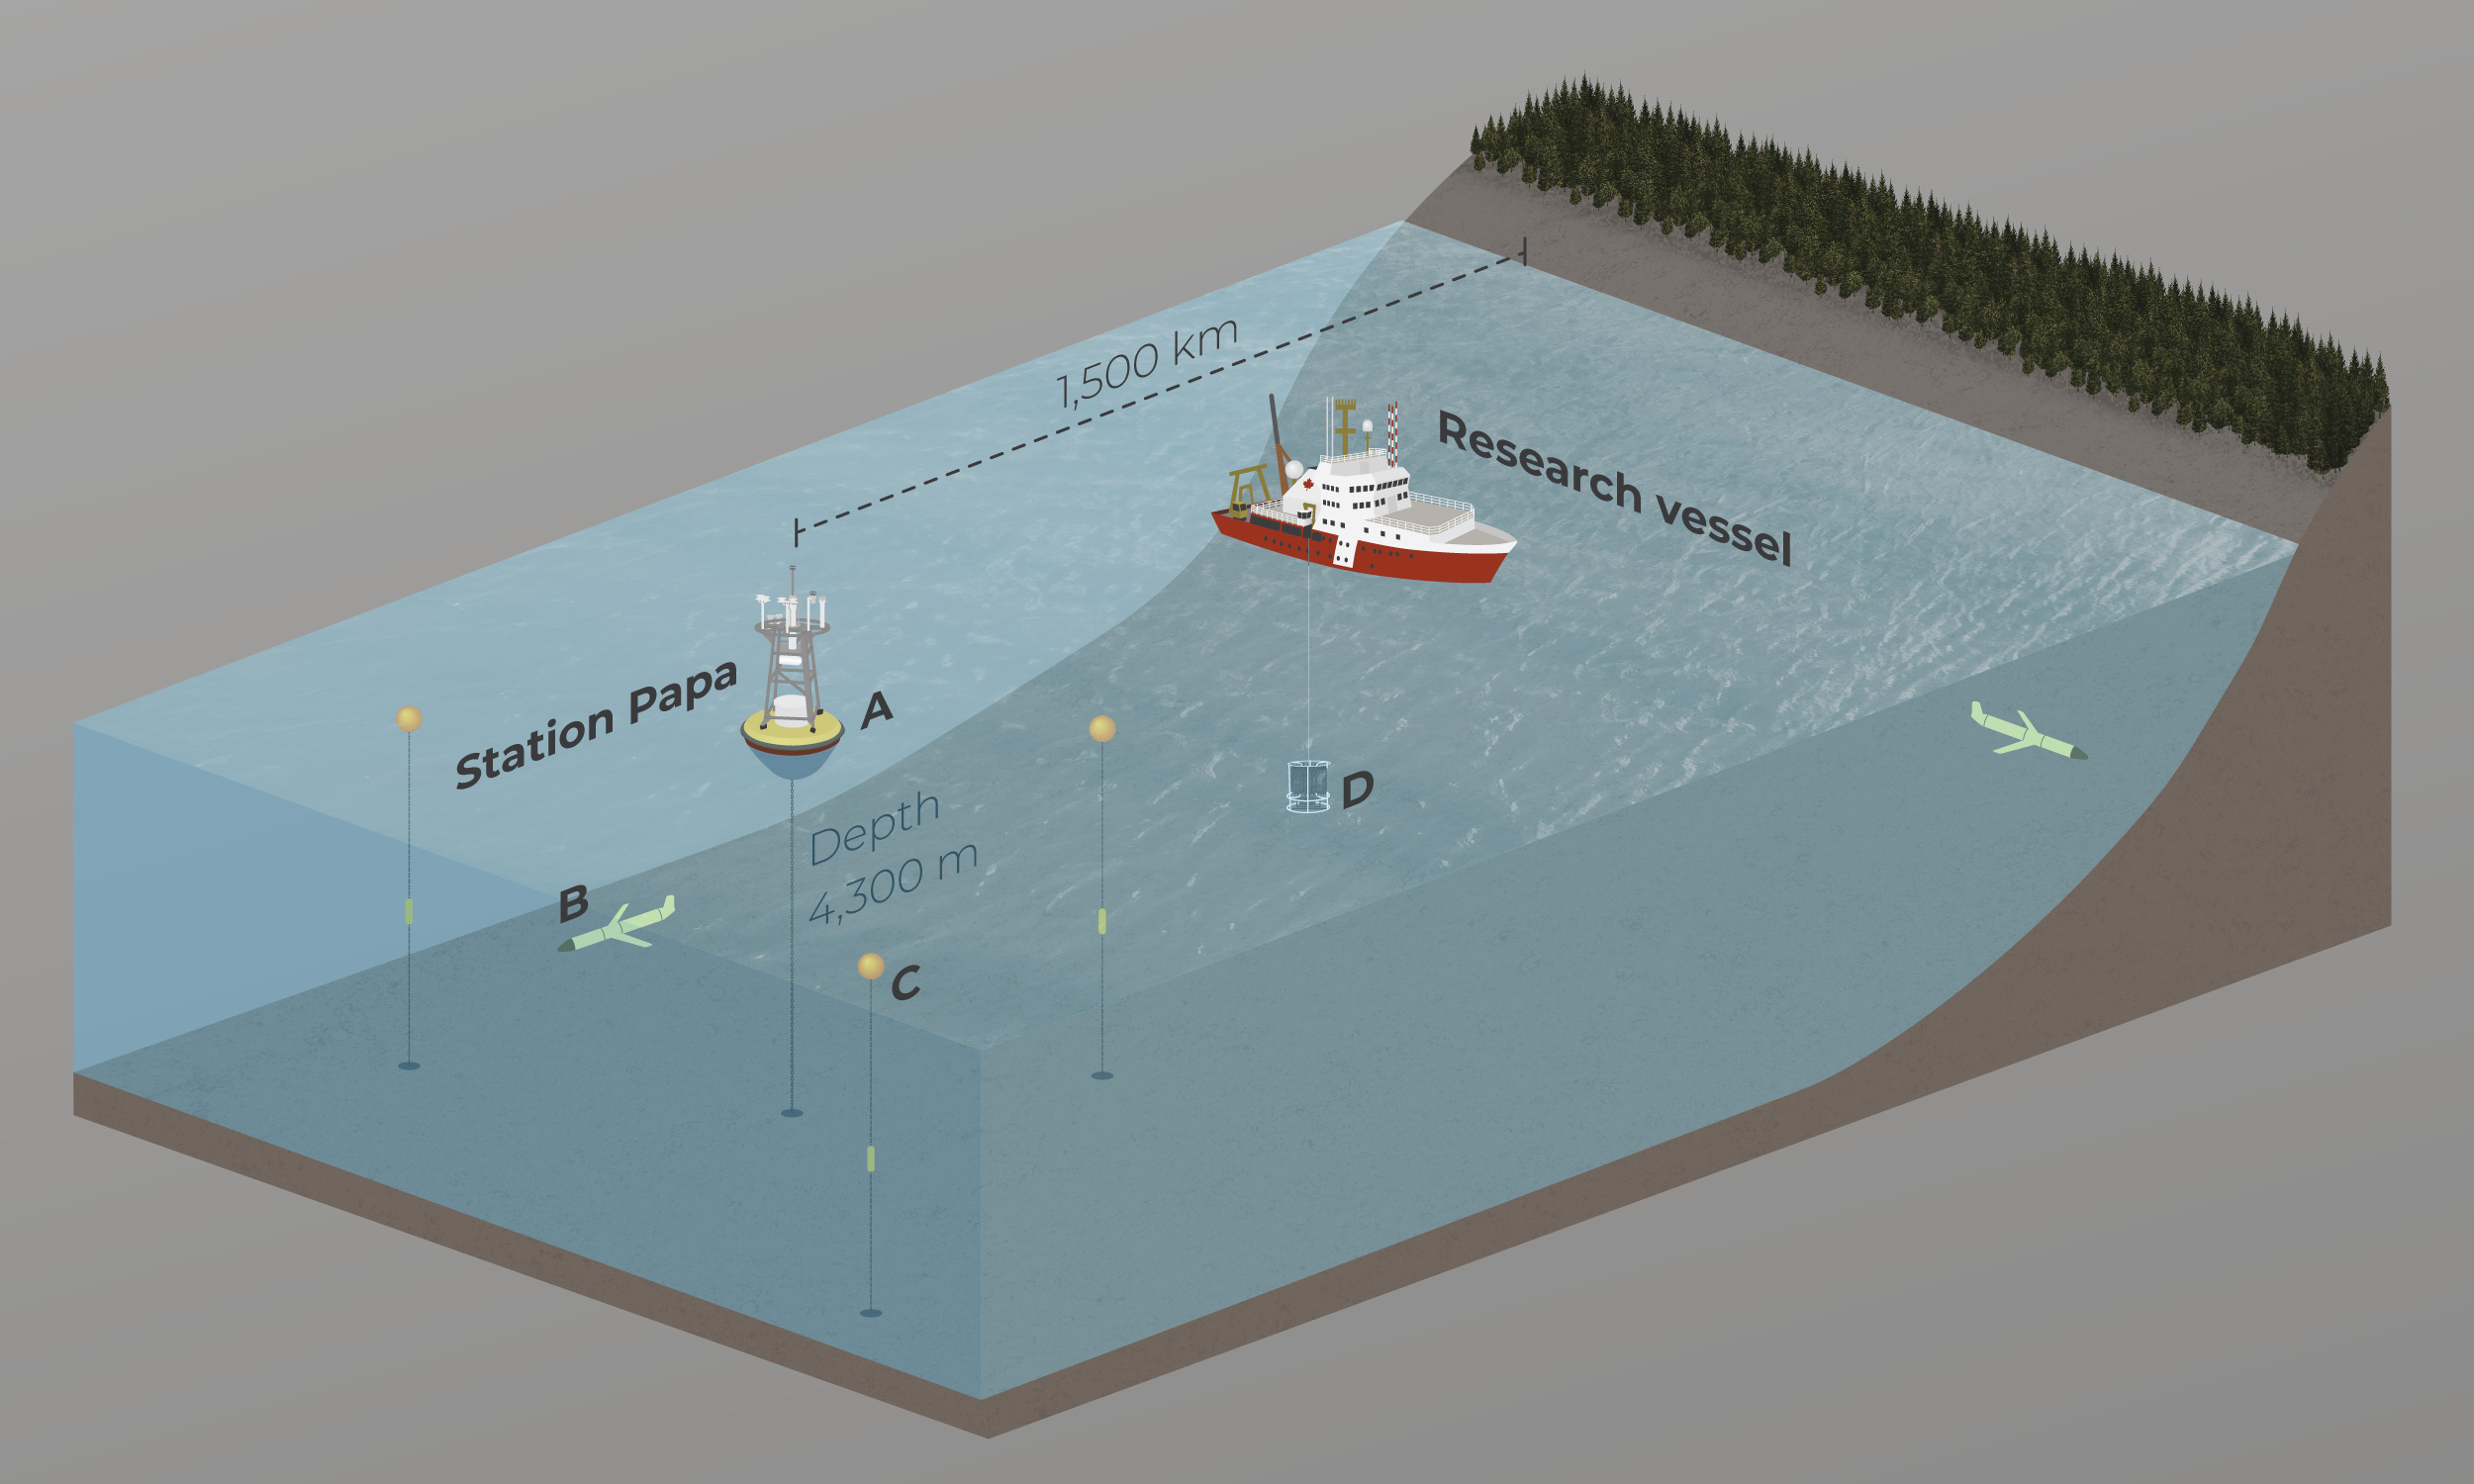
Ocean Station Papa, the last on the Line P series of oceanographic monitoring waypoints, is approximately 1,500 kilometers offshore, which is farther than the distance between Vancouver, British Columbia, and San Francisco, California. (Graphic is not to scale.) The National Oceanic and Atmospheric Administration (NOAA) surface mooring at Station Papa (A) is accompanied in this image by an autonomous underwater glider (B) and three subsurface moorings (C). The research vessel is taking measurements along Line P using a CTD rosette sampling instrument (D). Graphic by Mark Garrison/Hakai Institute
Over the years, Line P research has survived a boom-and-bust cycle of government funding and scientific shifts.
Beginning in the early 1980s, Station Papa grew from being a meteorological station to gathering additional oceanographic data to build on existing readings of temperature, salinity, and oxygen, some of which date to 1956.
Increasingly, the research focused on ocean productivity and information useful to commercial fisheries. Today, Line P also helps scientists understand how climate change is affecting the ocean—a benefit the project’s early researchers could not have foreseen when monitoring first began.
Scientists from around the world are keen to learn from Line P because it’s “one of the few places in the ocean where we know what ‘normal’ is,” says Ross.
A commitment from DFO to maintain Line P research cruises has spurred other organizations to invest in additional infrastructure at the site.
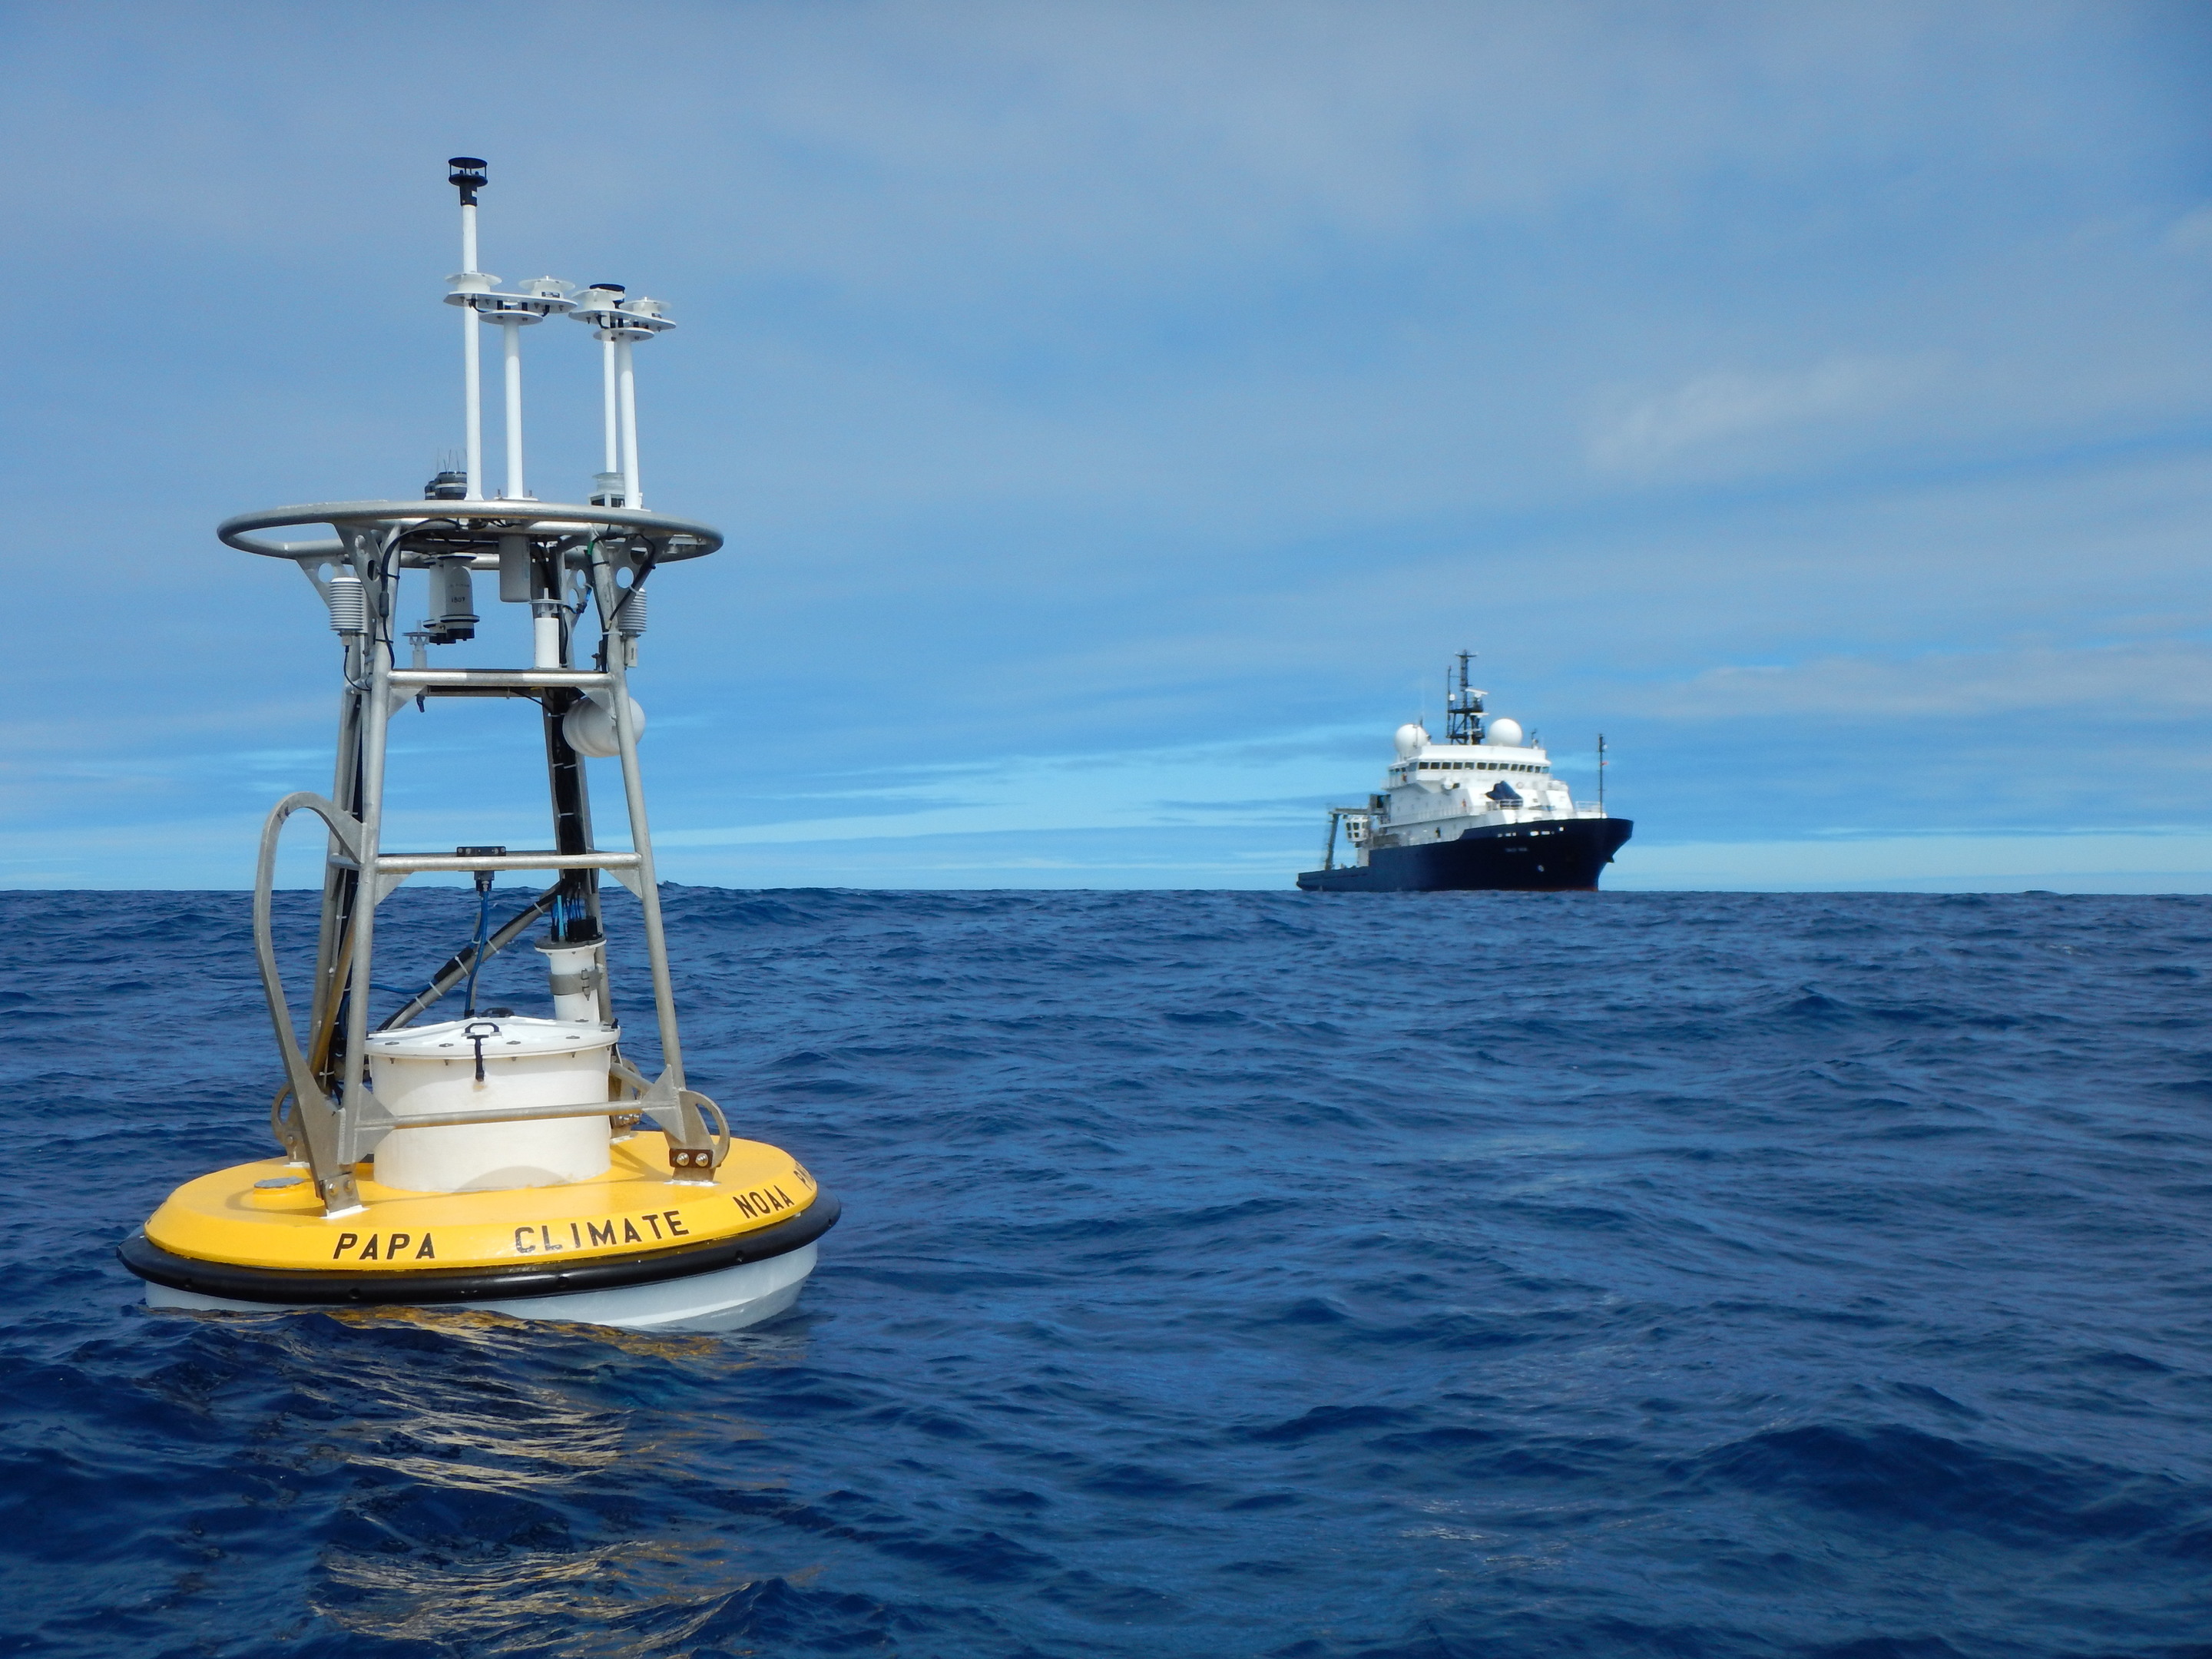
Station Papa was established in 1949 to collect meteorological data about incoming storms. It has since grown into the most important observation point along the Line P time series. Today, several research agencies including NOAA track conditions such as temperature, salinity, and oxygen from moorings. Photo courtesy of NOAA
“It’s like a Christmas tree with everyone wanting to put an ornament on it,” says Meghan Cronin, a research oceanographer who is the lead principal investigator for NOAA’s surface monitoring at Station Papa.
Various US research institutions operate six additional moorings and gliders outfitted with monitoring devices.
“It’s kind of a crowded little place out there, with instruments as close as they can get without bumping each other,” adds Cronin. “We have a history there, and now we can look at how things have changed. You can really start to see some trends over a 60-year series.”
Observations Before Written Records
In the absence of long-term written records, ocean researchers at ArcticNet are finding innovative ways to uncover long-term data to understand how the ocean is changing.
ArcticNet is a network of Canadian research centers focused on a broad study of oceans, lands, education, and health across the Canadian Arctic.
Philippe Archambault, ArcticNet’s co-scientific director, says the traditional knowledge of Inuit peoples is an increasingly important source of information for scientists.
While Arctic char like these are a traditional Inuit food source in Nunavik, Quebec, fishermen there are reporting increasing observations of Atlantic salmon, a species rarely seen in the past. Photo by Kai Jensen/NTB/Alamy Stock Photo
Through conversations with local Inuit communities in Nunavik, Quebec, ArcticNet researchers learned that Atlantic salmon, a species not historically found in the colder Arctic, are being observed with increasing frequency.
“We can be confident that these fish have not been here in the past, because local people fish here so frequently,” says Archambault. “Now we can definitely use this traditional knowledge as a baseline. The only way we found out about this shift was because of their knowledge.”
Scientists can also glean valuable data from the long Inuit history of hunting in and around water features called polynya—marine oases surrounded by sea ice, of which there are at least 23 across the Canadian Arctic, including the North Water Polynya located between Greenland and Canada.
The warmer waters that keep these spots ice-free support plankton, which attracts Arctic cod, and in turn, whales, walruses, seabirds, and polar bears.
Generations of Inuit people have intimate details of the life that has thrived in these places over time, part of an invaluable data set.
A Legacy of Sardines
The west coast of North America was once home to one of Earth’s great biomasses: sardines.
These formed the basis of the California fishery immortalized in John Steinbeck’s classic novel Cannery Row.
In 1949, in the wake of the sardine collapse, the US government launched an investigation to pinpoint the causes, which would ultimately become the California Cooperative Oceanic Fisheries Investigations (CalCOFI).
Monterey, California, was once the epicenter of the US sardine industry. Before the industry collapsed in the late 1940s, sparking a research investigation, Sicilian women operated many of the local canneries. Photo courtesy of California History Room/Monterey Public Library
Today, CalCOFI continues to sample the ocean, deepening our understanding of marine physics, biogeochemistry, and biology—which in turn can enable better management of fisheries and other resources.
The program has also evolved to track long-term changes in ecosystems across the southern portion of the California Current, a massive cool-water current that sweeps southward from British Columbia to Mexico. It is now one of the longest-running and most comprehensive marine ecosystem time series in the world.
Brice Semmens—CalCOFI director and professor of marine biology at the University of California, San Diego—says the data can be seen as “a Keeling Curve for the California Current,” referencing the data-gathering program established by Charles David Keeling on the Mauna Loa volcano in Hawai‘i.
Both data sets cover roughly the same period, one for the atmosphere and one for the waters off California, with the difference being that the California Current is “noisier” and more complex than CO2 emissions into the atmosphere.
In the 1960s, CalCOFI’s research on the California Current led to the realization that the El Niño–Southern Oscillation—a climate phenomenon now known to affect precipitation, temperature, and storms around the world—was a Pacific-wide occurrence.
This has been a huge boon to understanding climate and weather patterns.
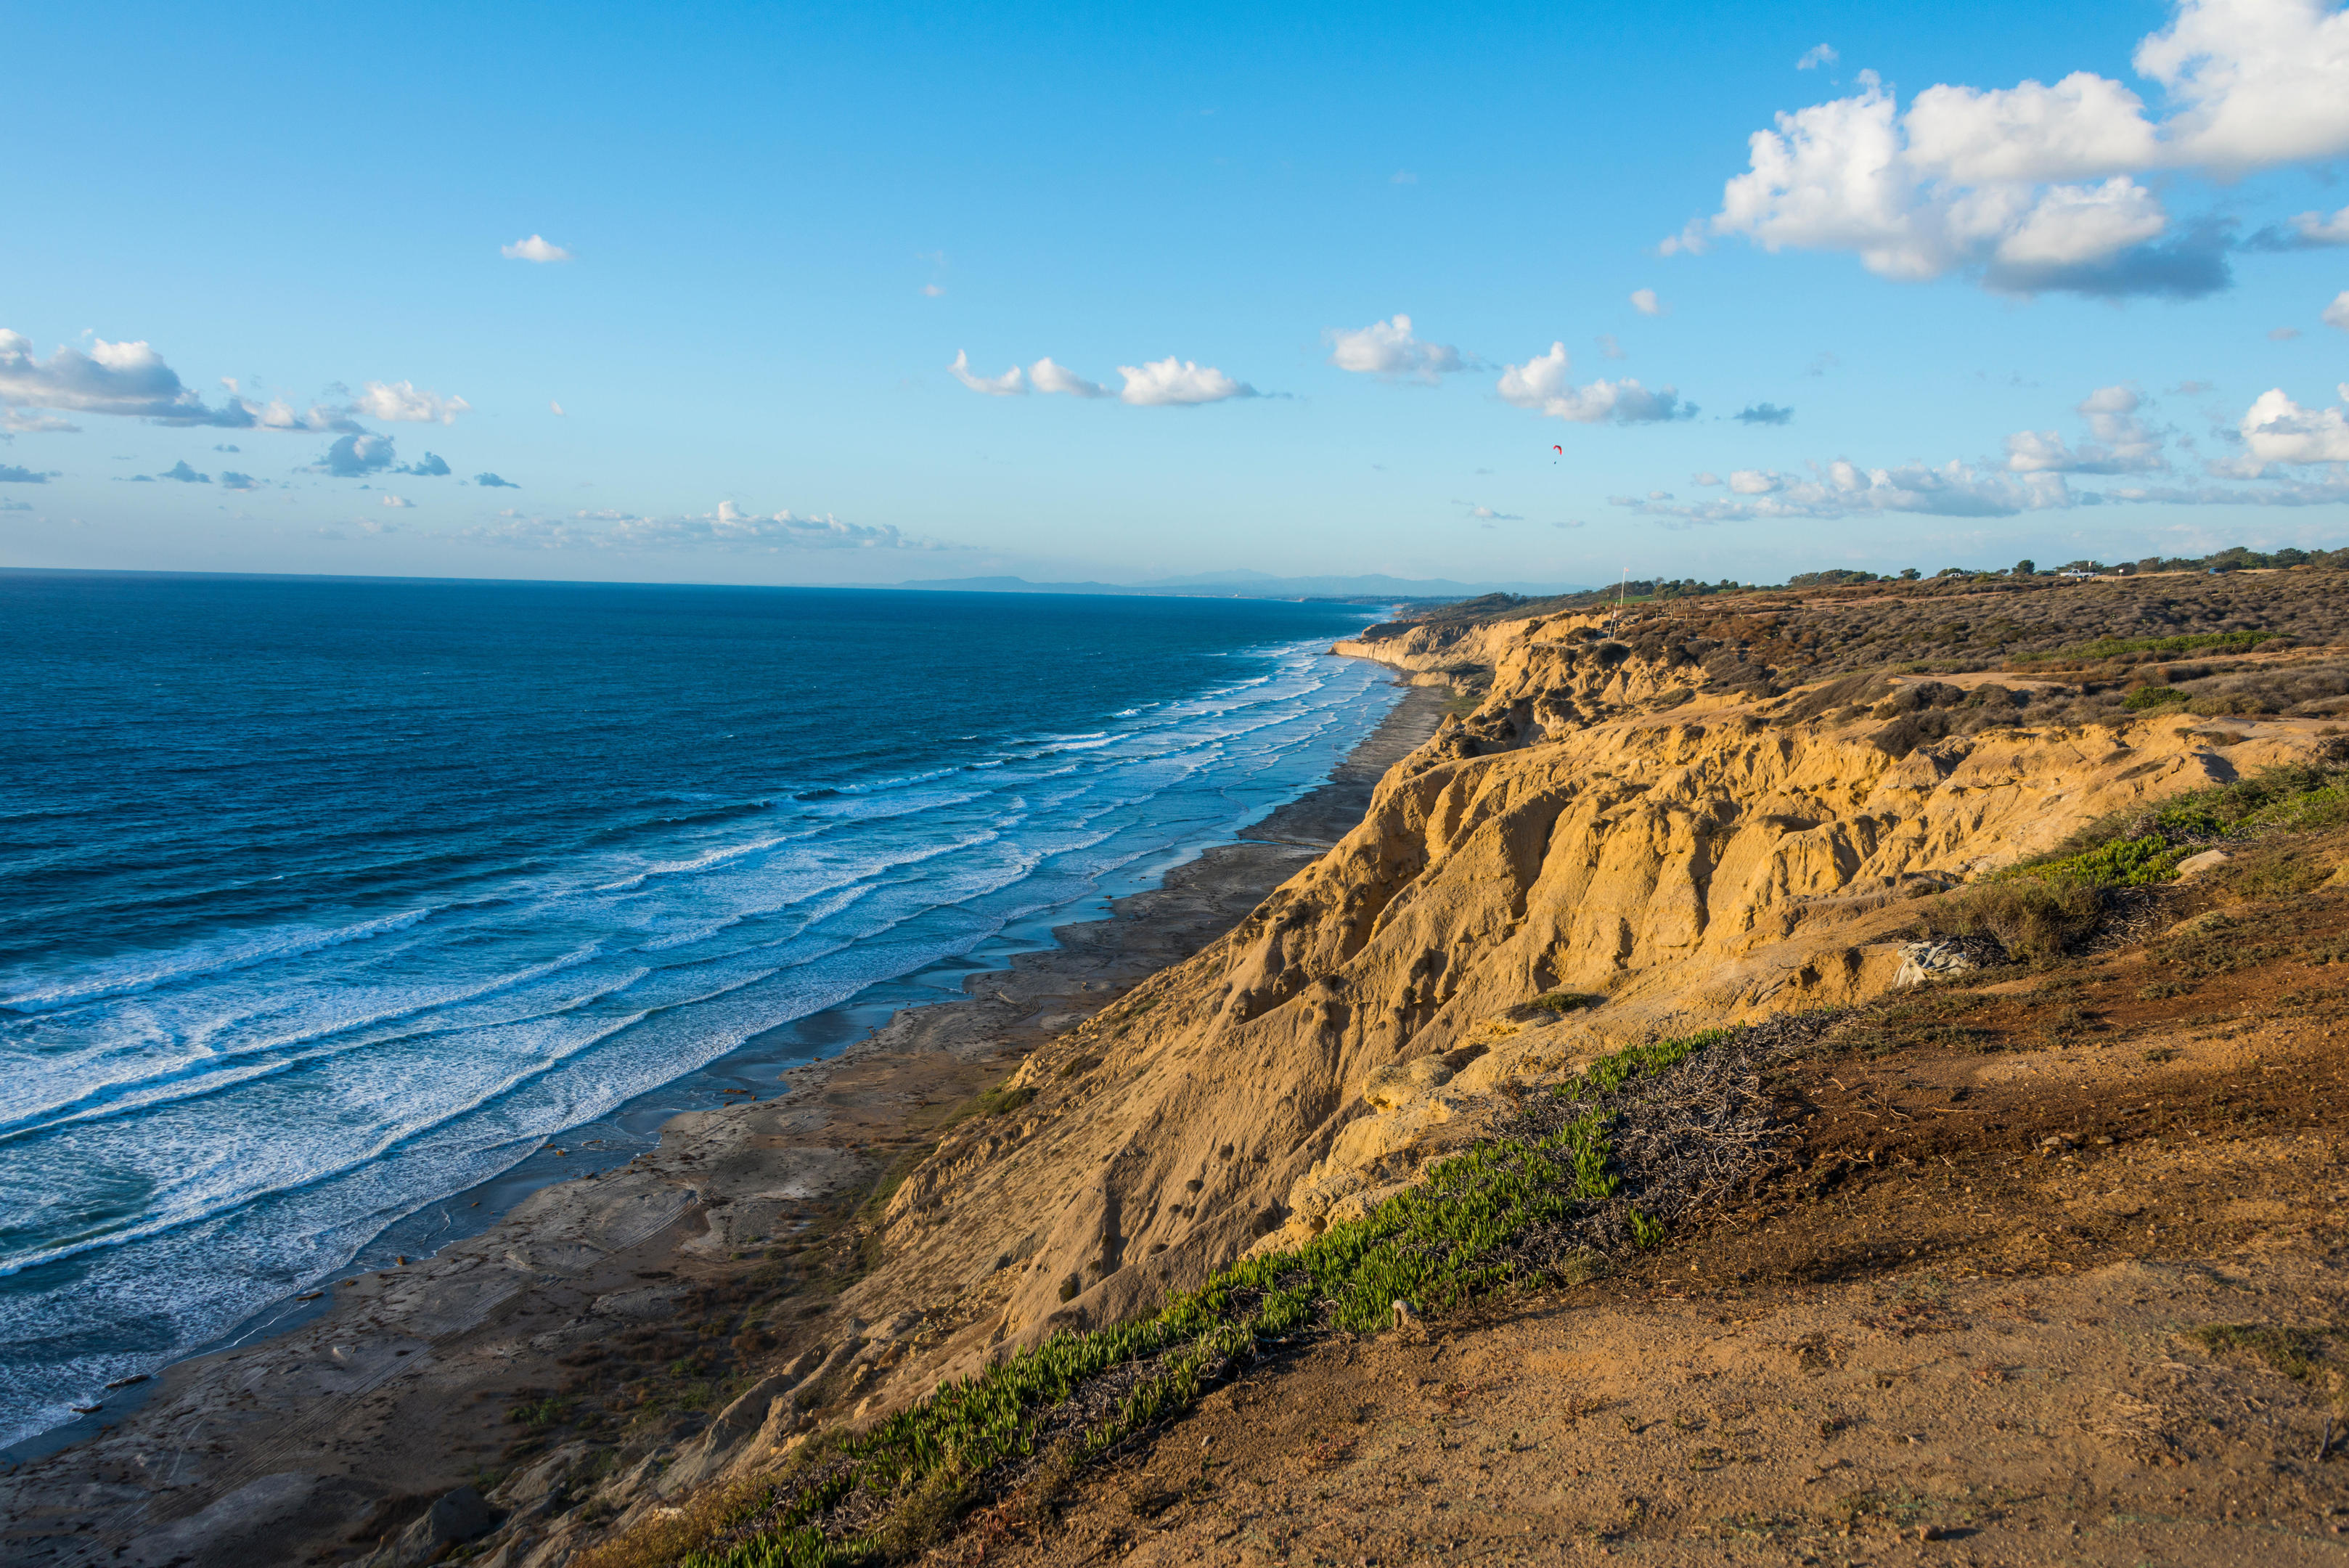
The Torrey Pines State Nature Reserve in San Diego, California, offers views up the California coast. Nearby, the University of California, San Diego, is home to the California Cooperative Oceanic Fisheries Investigations (CalCOFI) program, which conducts quarterly research cruises to more than 75 stations. Photo by Michael Runkel/Westend61 GmbH/Alamy Stock Photo
There’s a paradoxical benefit of long-term monitoring, one that ought to be celebrated but can be difficult to explain, particularly to potential funders: the notion of “pre-relevance.”
CalCOFI conducts quarterly ship-based surveys from more than 75 stations in Southern California.
Laid out in parallel lines—the remnant of the original testing grid that spanned the Baja California peninsula in Mexico and the entire California coast—these points stretch 500 kilometers from the shoreline out to sea.
CalCOFI data includes physical and chemical oceanographic information as well as samples of phytoplankton, zooplankton, larvae, and fish eggs.
“The best but most uncomfortable reason for why long-term monitoring programs are important,” says Semmens, “is that we’re going to pull something out of the monitoring data that we don’t yet know exists. The data is important for reasons that we haven’t even conceptualized while we’re out there collecting it.”
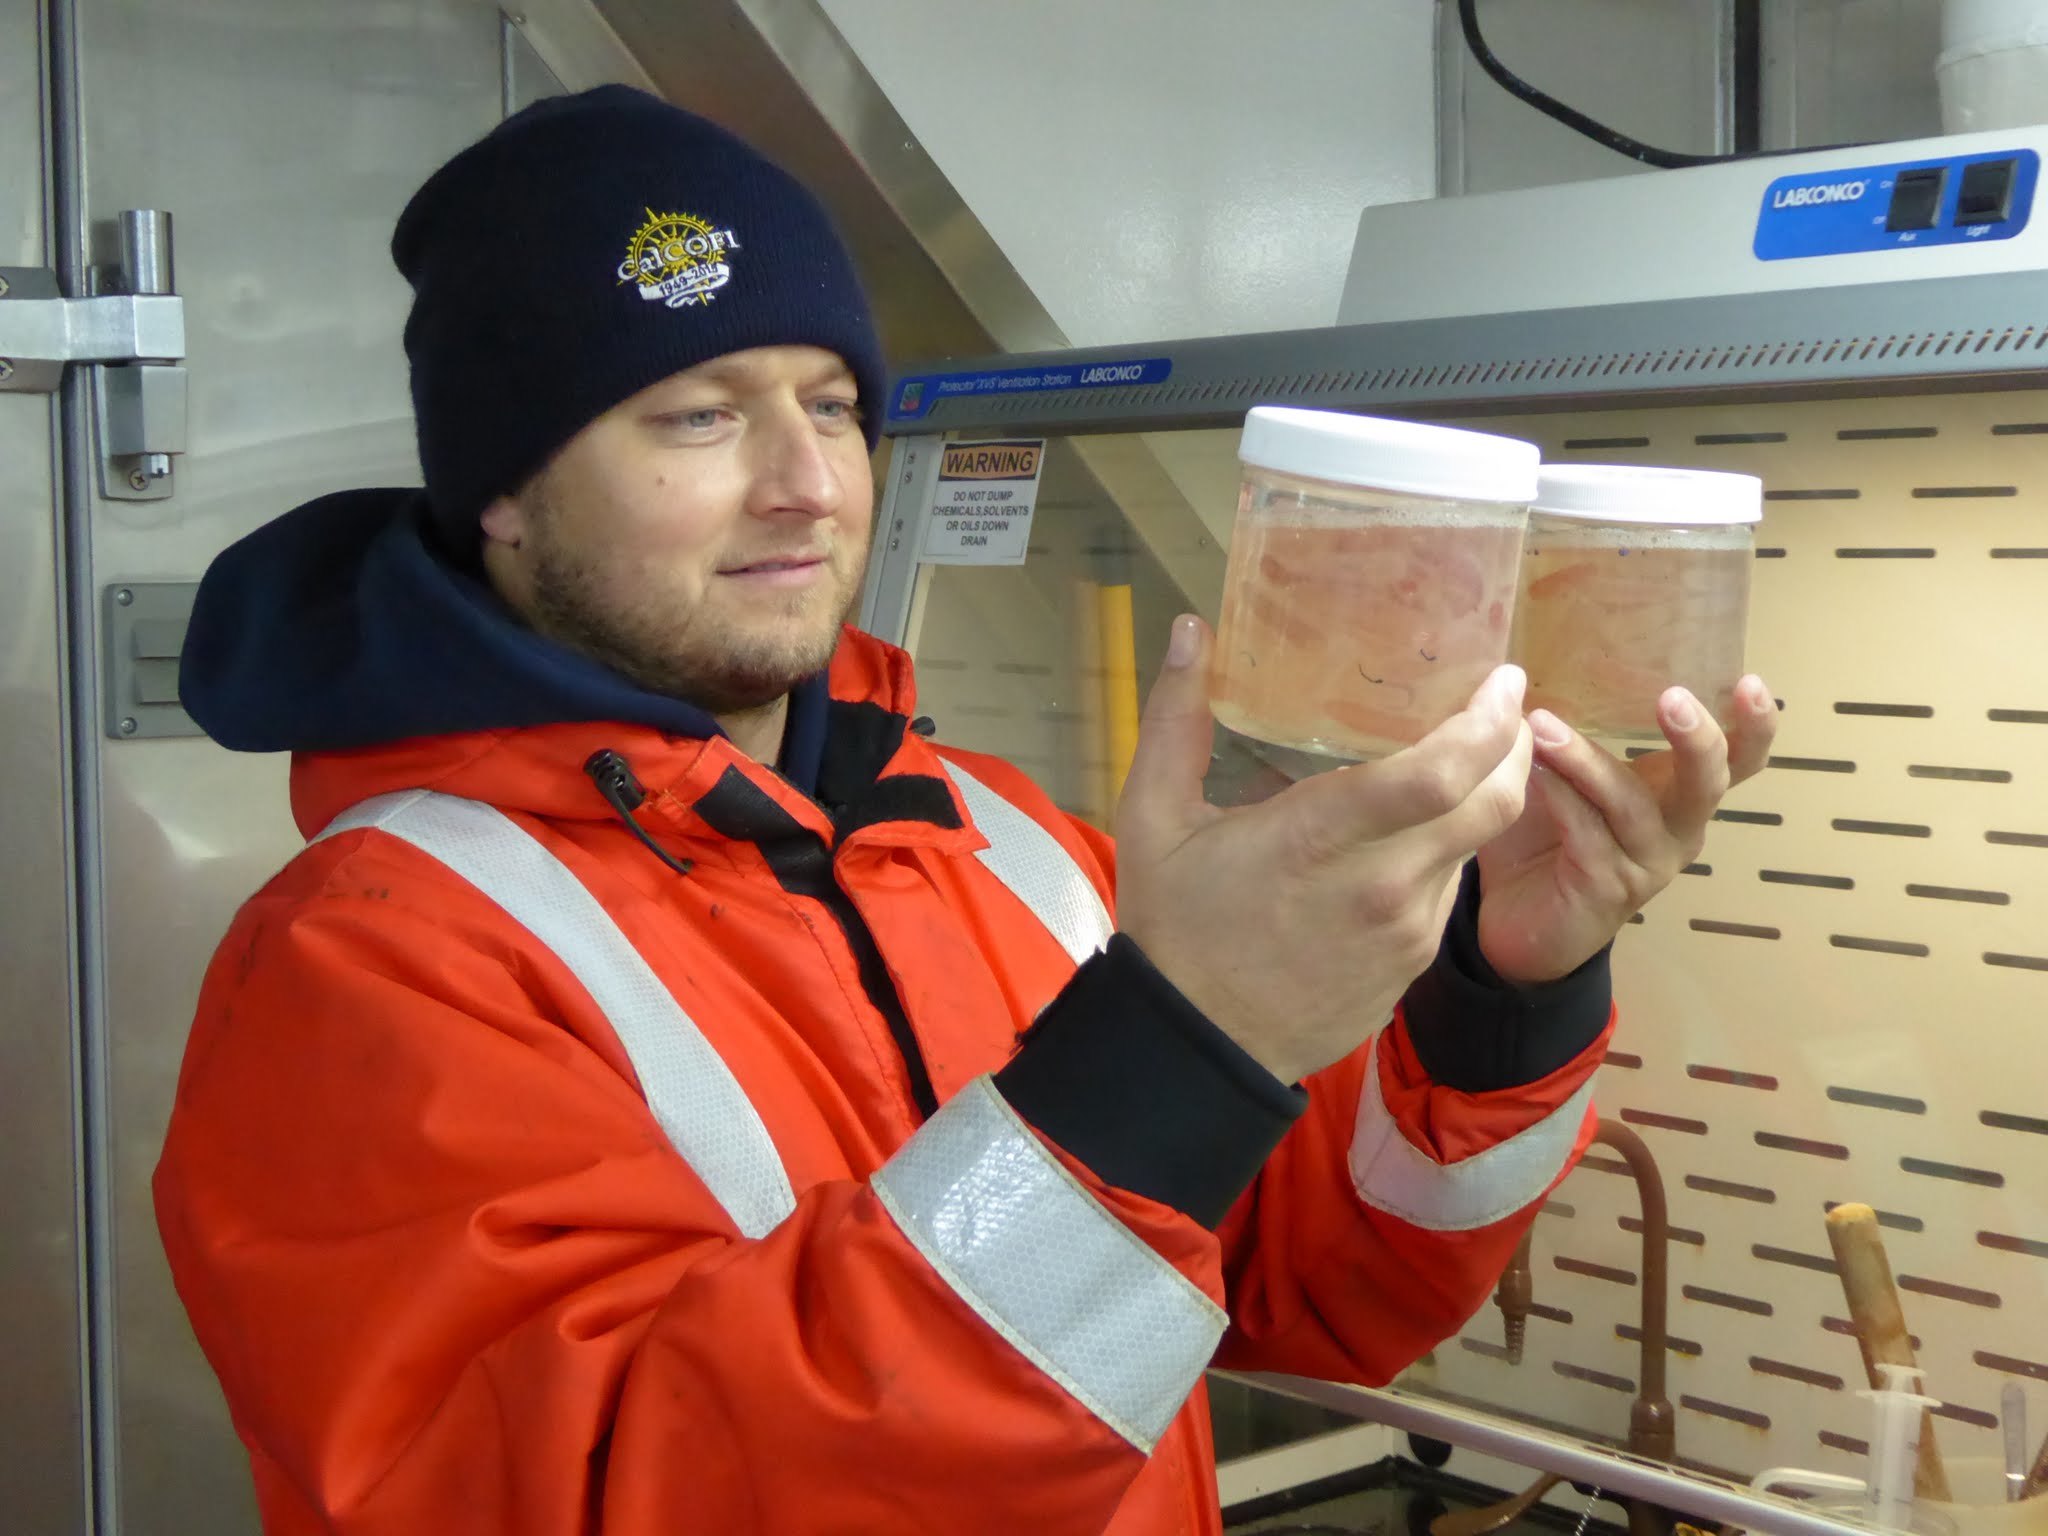
A CalCOFI researcher on a 2016 cruise examines jars of organisms, mainly small pyrosomes, from a sampling net. CalCOFI’s archive of biological samples offers a trove of insights, from DNA to data on pollution and toxin levels. Photo by James R. Wilkinson/SIO-CalCOFI
In other words, the data has pre-relevance; the insights that can be drawn from it won’t be clear for years or decades to come.
“We didn’t really understand what DNA was when CalCOFI started back in the late forties,” Semmens continues, “but nowadays, we can interrogate all of the collections that we have across the time series using tools that weren’t even conceptualized, let alone developed at the time the program was started.”
Beyond DNA, scientists are using compound-specific stable isotope analysis—a method that has emerged only in the past 20 years or so—on the collections to understand how the food web of the California Current has changed over 75 years.
The best example of pre-relevance, he says, is the new effort to understand how DDT and related toxins historically dumped into the waters off Southern California have moved through the marine food web over the decades.
“Using our samples, we can hindcast toxin loadings in marine fish all the way back to the time of dumping,” says Semmens. “This effort is certainly not something conceived of by CalCOFI founders, but it is now possible because of the consistency of sampling the program maintained for most of the last century.”
Shedding Light on the Future
Du Preez has gone to the BC seamounts every year since 2017.
She’s set up monitoring sites that will form the basis of a growing data set.
Researchers aboard the John P. Tully Canadian Coast Guard vessel deploy oceanographic sampling equipment before dark. Photo by Glenn Cooper/Fisheries and Oceans Canada
In this time, she has witnessed the alarming demise of red tree (Primnoa pacifica) and bubblegum (Paragorgia spp.) corals, both closely related to bamboo coral.
One of the affected red tree coral colonies on the SGaan Kinghlas–Bowie Seamount was three meters high and had been alive for 300 years.
“We saw it die completely in three years. It’s incredible in the worst kind of way,” says Du Preez, adding that these kinds of changes are happening throughout the deep ocean.
She notes that it’s typical for there to be a layer of low-oxygen water—called an oxygen minimum zone or OMZ—in the northeast Pacific. This zone is where bacteria consume small organic particles (often called marine snow), which then eat up oxygen at a rate faster than it can be replenished.
The vertical location of OMZs varies, but near these BC seamounts, they’re typically at depths between 470 and 1,800 meters.
Based on Line P data and other research, however, Du Preez and Ross point out that the OMZ here is expanding at about three meters per year. Overall, in the past 60 years, the top 3,000 meters of the northeast Pacific has lost 15 percent of its oxygen.
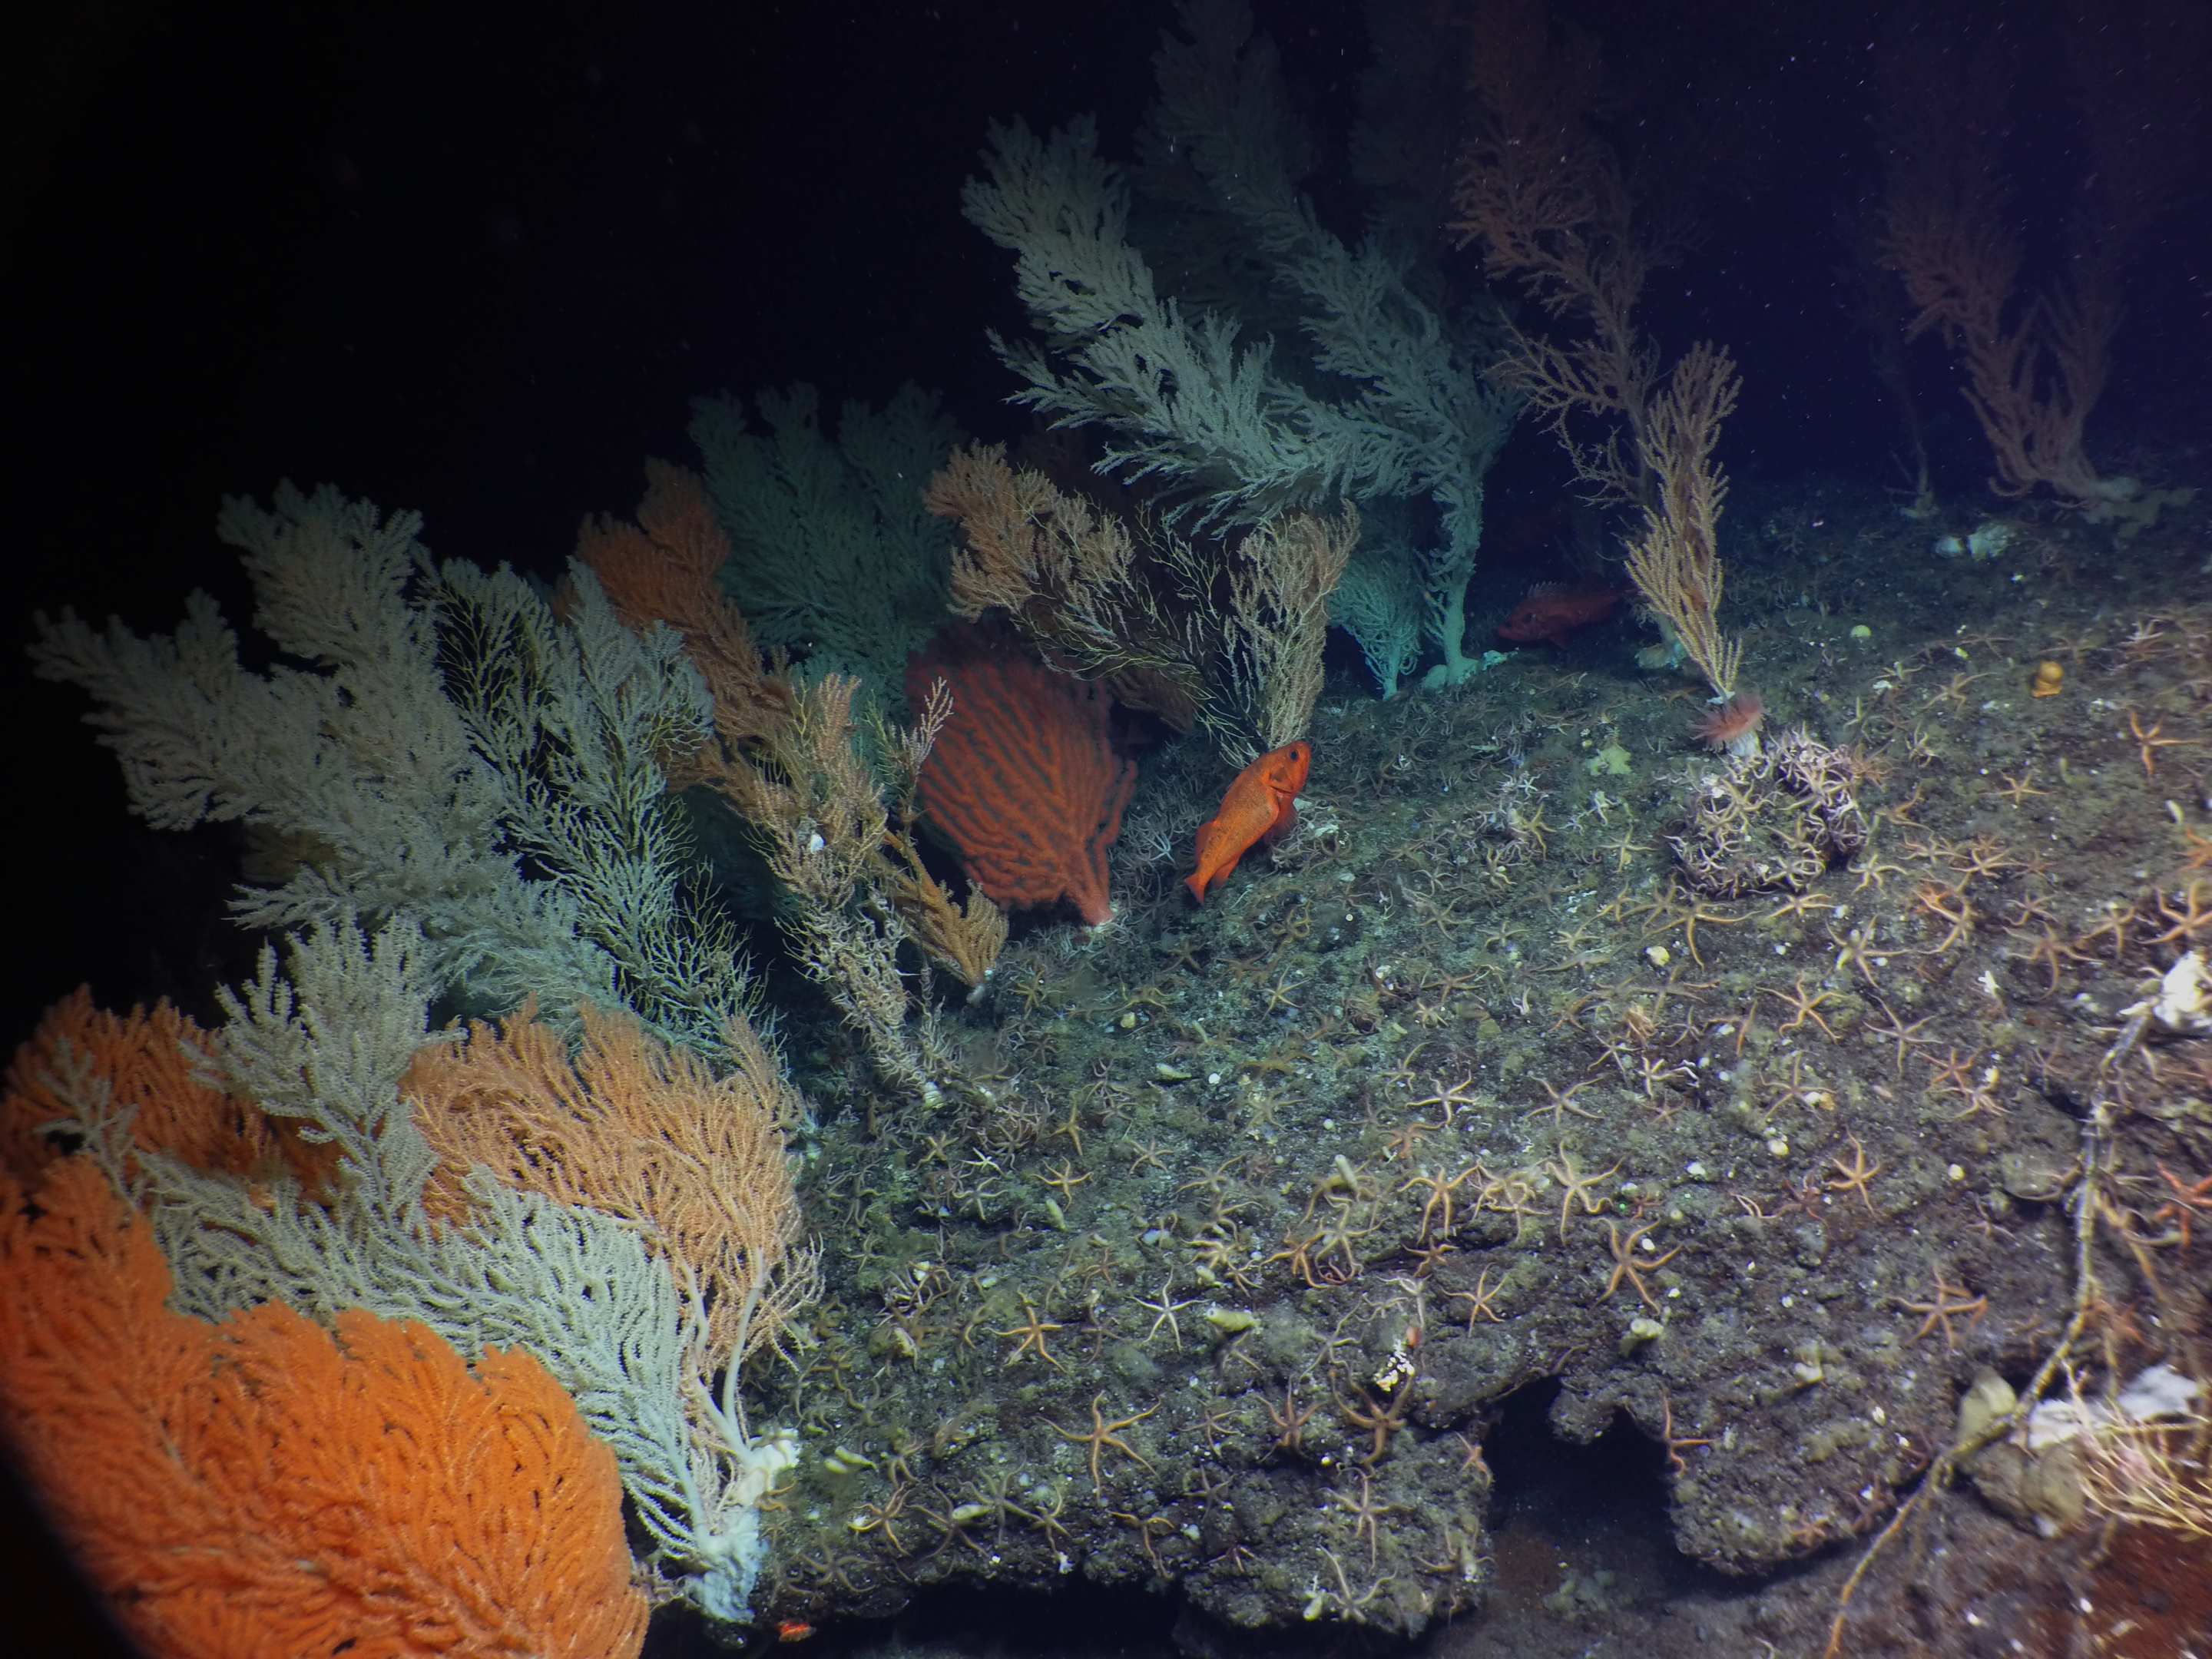
The Pacific seamounts are home to gardens of red tree and bubblegum corals, but Du Preez has seen alarming die-offs in recent years. Photo courtesy of Northeast Pacific Seamounts Expedition Partners and Ocean Exploration Trust
Coupled with the phenomenon of acidification, this alarming growth of hypoxic waters means that a significant portion of the ocean is becoming more hostile to life, squeezing habitats into smaller and smaller areas.
“What we found was that the upper 500 meters of the ocean is becoming more acidic,” says Ross of the waters around the Pacific seamounts. “Because the horizon of where corals could comfortably grow was shallowing, the oxygen minimum zone was also expanding, but mostly on the bottom.”
The seamount area is a candidate for marine protected area (MPA) status, with an agreement for the tentative Tang.ɢwan–ḥačxwiqak–Tsig̱is MPA (roughly pronounced tung-gwun huch-khwi-kuk tsee-geese) reached in February 2023 between the Canadian government and the Council of the Haida Nation, Nuu-chah-nulth Tribal Council, Pacheedaht First Nation, and Quatsino First Nation.
While stricter regulation of fishing, oil drilling, and deep-sea mining will reduce some stressors, seamount ecosystems—like many in the global ocean—are still threatened by hypoxia and other long-term climate trends.
Du Preez’s current round of funding is for five years. Thanks to the ongoing co-management and commitments by coastal First Nations and Canada to protect 30 percent of the ocean by 2030, she is optimistic that the work will go on beyond that horizon, into the realm of long science.
Her job for now, she says, is to return to the seamounts.
The Canadian Coast Guard research vessel John P. Tully holds its position in calm seas. Video by Shelton Du Preez/Fisheries and Oceans Canada
References and Credits
Sources
- Canada’s oceans now. Fisheries and Oceans Canada, 2021
- Rapid deep ocean deoxygenation and acidification threaten life on Northeast Pacific seamounts. Ross et al., Global Change Biology, 2020
- Bridging from monitoring to solutions-based thinking: Lessons from CalCOFI for understanding and adapting to marine climate change impacts. Gallo et al., Frontiers in Marine Science, 2019
- Slow reception and under-citedness in climate change research: A case study of Charles David Keeling, discoverer of the risk of global warming. Werner et al., Scientometrics, 2017
- Cinderella science. Euan Nisbet, Nature, 2007
Creative Team
Produced by Tyee Bridge, Christopher Pollon, Jonathan Kellogg, Serena Renner, and Jeremy Latham with assistance from Brad deYoung, Mark Garrison, Jorin Weatherston, Meig Henry, and Wiley Evans (as members of the Hakai Institute, on behalf of CIOOS, CIOOS Pacific, and for cioospacific.ca). Fact-checked by Sophie Weiler; copyedited by Ruth Wilson; and proofread by Shannon Garrison.